ISSS608 2016-17 T1 Assign2 Ong Han Ying - Approach Interactive Tools
|
|
|
|
|
|
|
|
|
|
|
|
|
|
|
|
|
|
|
|
| CONTENT |
|---|
|
_____6.4: Interactive Tools |
6.4: Interactive Tools
Interactivity in a visualization is important because it helps the audience to discover further insights to the analysis. In this section, we will be based on our initial layout, and highlight possible interactivity tools for our visualization.
6.4.1: Commonly Used Interaction Technique
Based on our initial layout, we have selected the following commonly used interaction techniques to be included;
| Technique | Selection | Rationale |
|---|---|---|
| Select | Ability to select the the bar. | |
| Explore | ||
| Reconfigure | Sorting & Re-expressing (By expressing both frequency & % of Total) | |
| Encode | ||
| Abstract/Elaborate | Highlighting (To select records on the graph) | |
| Filter | Select records based on a set of criteria | |
| Connect | Linking Multiple Views together |
6.4.2: Selection & Connect
"Selection" is a mean of selecting a single data point and/or a group of data - using a pointer. This function is useful when we applied it to "Connection", where we link multiple views together.
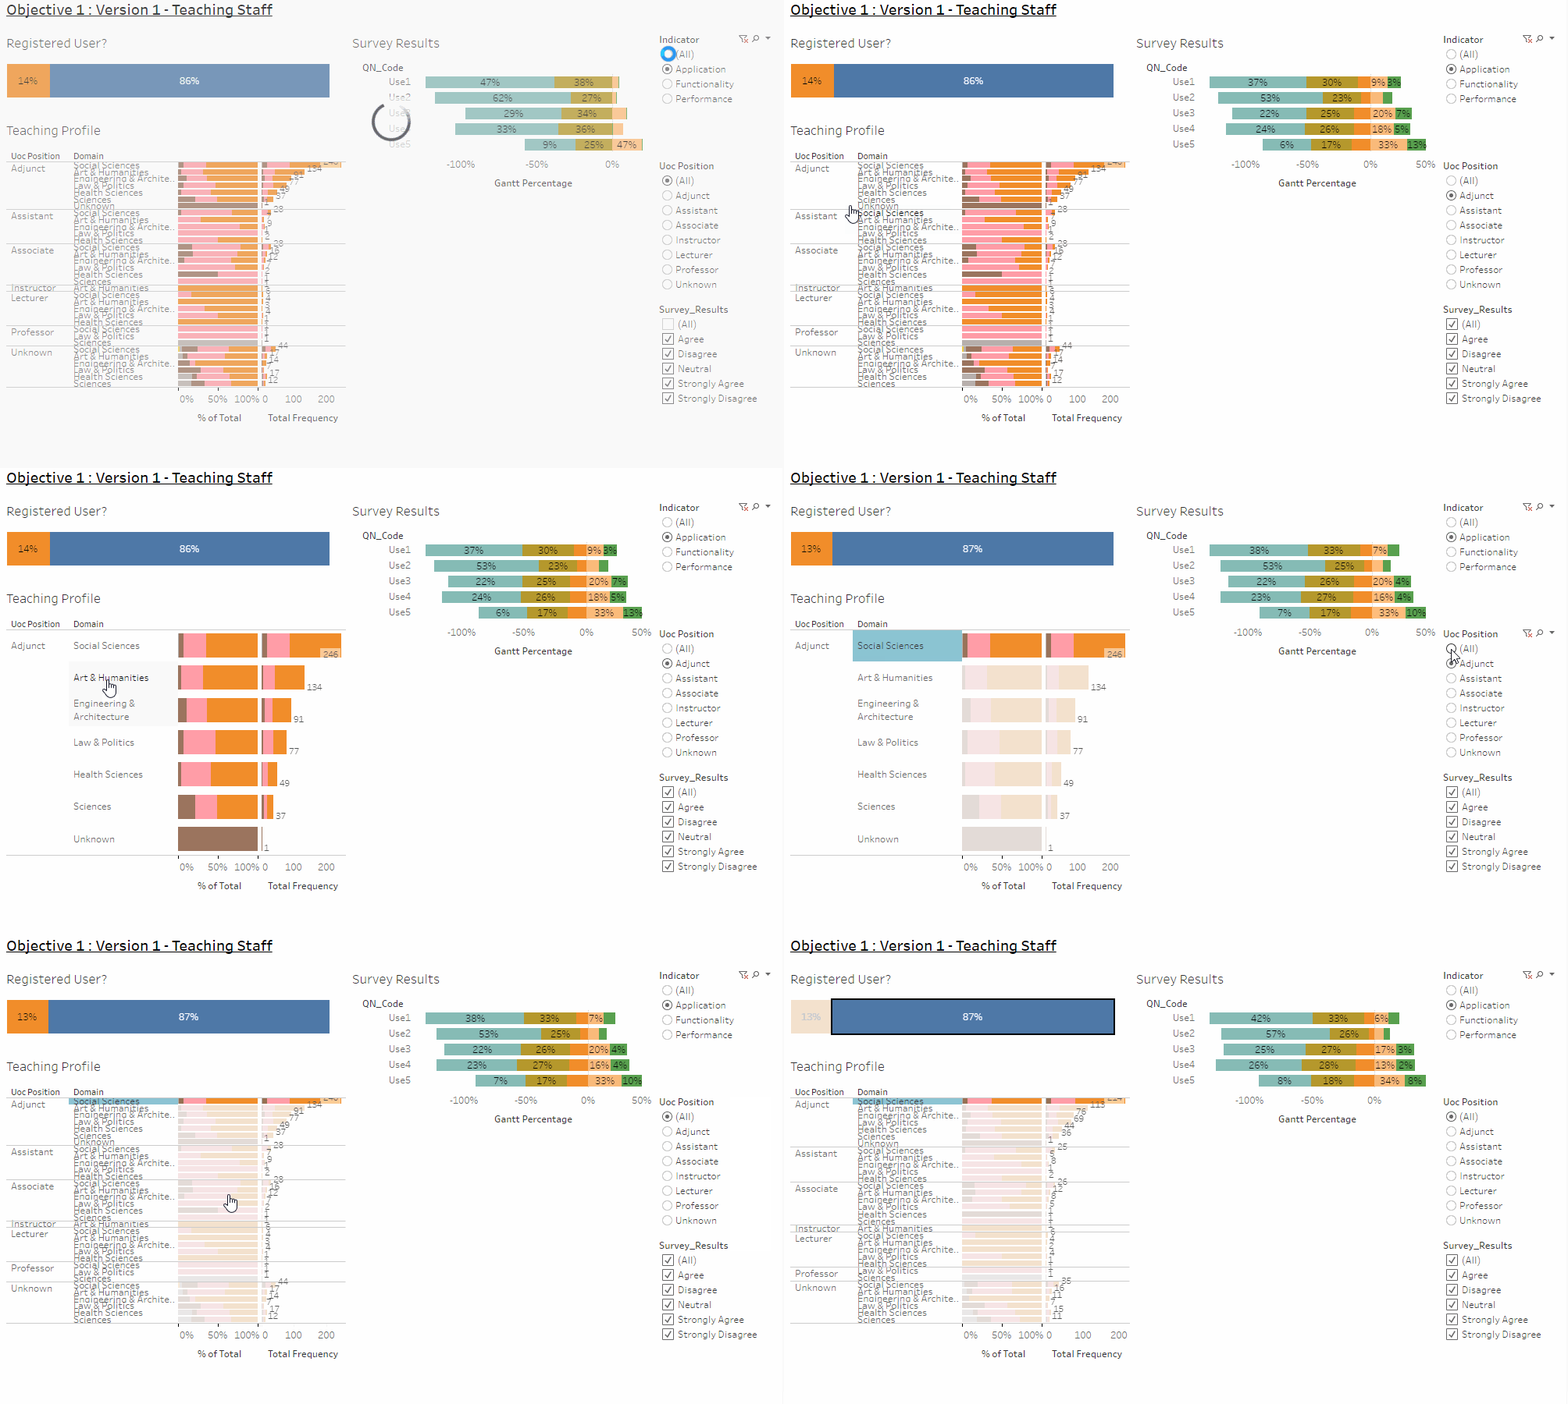
In our layout, it was organized in a way that we are about to do our selection on the "Teaching Profile" and/or "User Profile", the respective results will be display. This is illustrated as below;
6.4.3 Filtering Function
Next, we will also introduce the function of filtering, where we are able to filter the results of the analysis based on the criteria that we have selected,
Filtering function can also be used together with "Selection" and "Connect", where we filter the data based on a set of selection criteria, and then; further filter the data by selecting on the graphs; in this case - the "teaching profile" and "personal profile". An illustration of this as below;
6.4.4: Reconfiguration
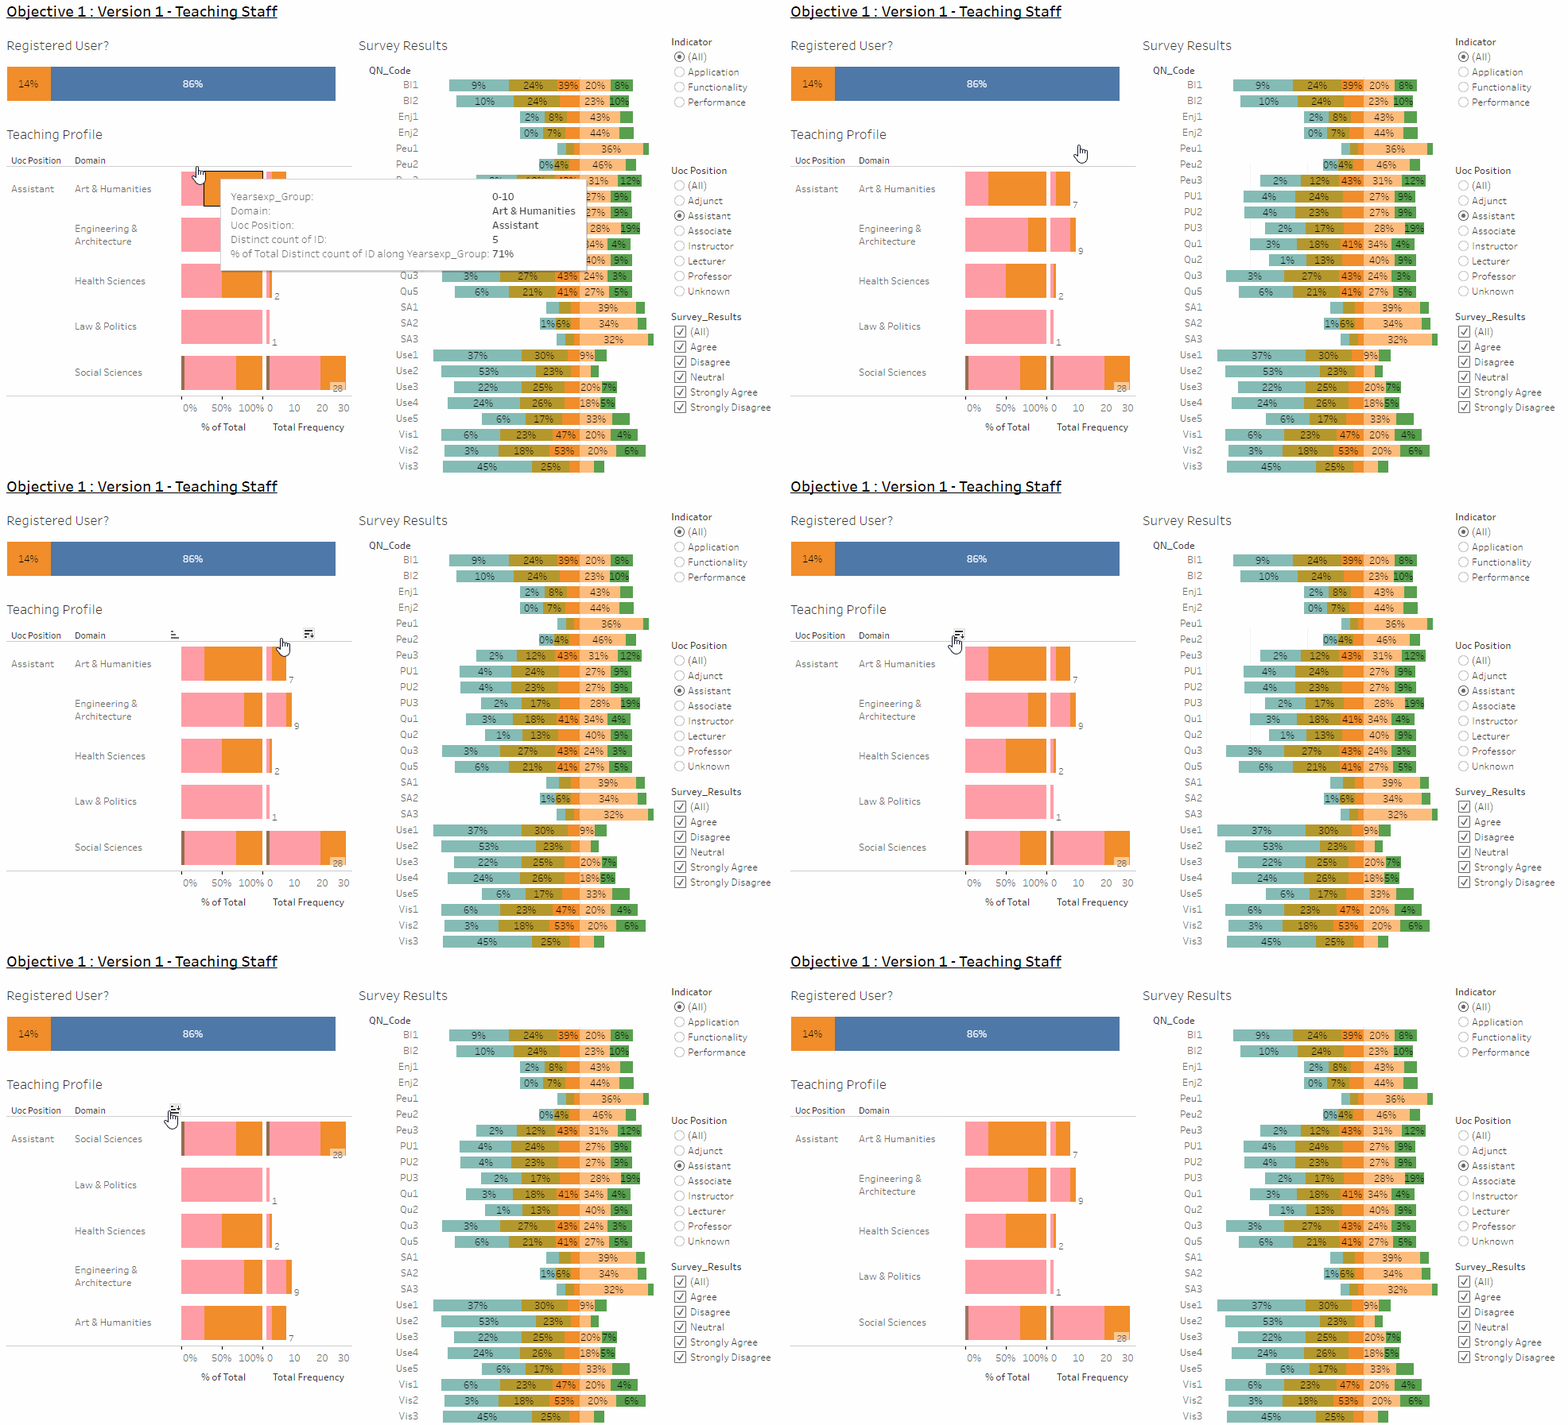
Last but not least, the visual graph will allow us to reconfigure the data by doing a "sort" of the data, either by ascending or descending order, as illustrated below;
Previous Sub-section - 6.3: Visualization Graphics and Tools


