ISSS608 2018-19 T1 Assign Tan Le Wen Angelina Task 3: Factors affecting Air Quality
|
|
|
|
|
|
|
|
Task 3 Visualisations and Insights
Contents
Joining the Dots…
In general, concentration of air pollutants is governed by the meteorological parameters such as atmospheric wind speed, wind direction, relative humidity, and temperature. After going through Task 1 and Task 2, there are a couple of inferences that were made, such as the level of concentration of PM 10 is inversely proportional to the temperature, and the higher the altitude, the lower the concentration level. In this section, we will be exploring the correlations the meteorology and topography of Sofia City, with the level of concentration of PM 10. External factors such as locations of Power Plants and transportation networks will be examined as well.
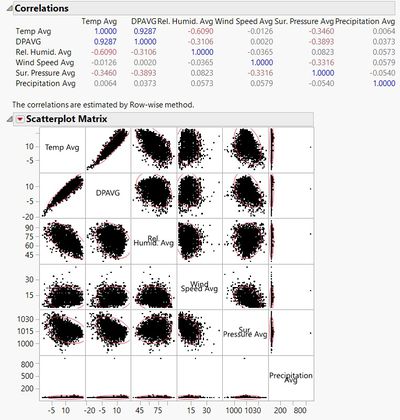
From this image, we see that relative humidity is negatively correlated to temperature. Just to jog our memories, relative humidity is the ratio of amount of water present in air to the equilibrium vapour pressure. Hence as temperature rises, air expands and is able to hold more water, causing its relative humidity decreases. The other correlations are not as strong.
Feel the Heat: Temperature is Rising
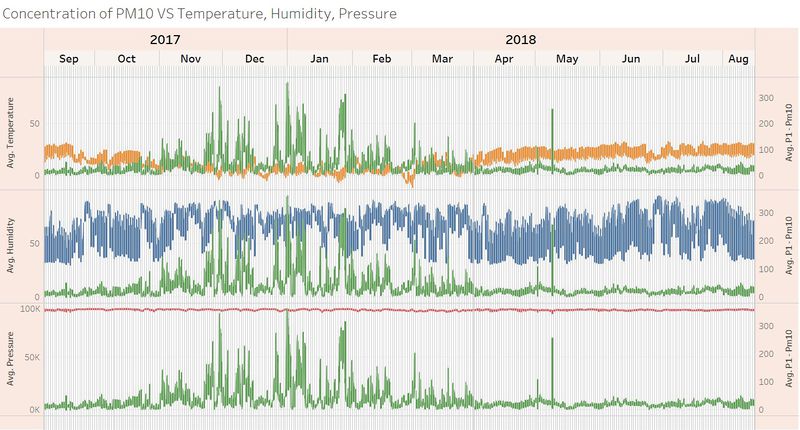
According to the graph, temperature is inversely correlated with the level of pollution. There are two trains of thoughts with regards to this image, both are quite different from each other:
- Cold air sinks, and PM 10 particles are relatively large in size (as compared to other dust particles found in our atmosphere) hence they remain on the ground, contributing to the concentration level.
- The increase in pollutants is not because of the low temperature per se, but because of actions done due to the low temperature. Confused? Stay with me – the reason why concentration levels are high during cold season is because people are burning more solid fuels to keep themselves warm, releasing more air pollutants, hence driving up the pollution level.
In fact, studies have shown that in some Oriental countries, temperature is actually positively correlated to air pollution, which is India for this paper. India may not have distinct 4 seasons, but she has monsoon seasons. Though temperature range was almost equal both in monsoon and post-monsoon seasons, the temperature-pollutants correlations are contradictory because the rain washed out the pollutants during monsoon which reduces the pollutant concentration [1].
We saw that relative humidity is inversely proportional to temperature. From this image, we can see when the relative humidity is smaller (which corresponds to higher temperature), the level of concentration is higher. From the graph, it can be inferred that pressure does not play a role in influencing the pollution level.
Other Meteorological Factors?
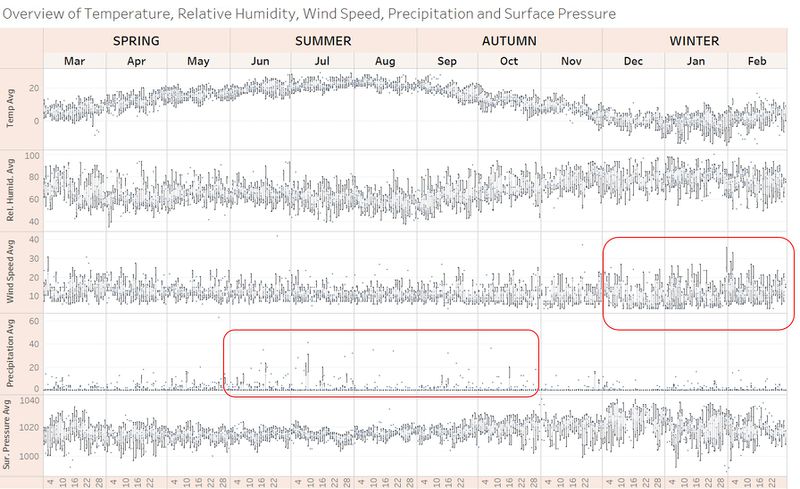
During Summer, Bulgaria does have thunderstorms which is shown in the graph above. There are more precipitation values during Summer and Autumn, which will wash away the air pollutants, as mentioned in the previous section.
The pattern for wind speed is rather counter-intuitive: the average wind speed is greater Winter as compared Summer and autumn. I would presume that higher wind speed would blow the air pollutants away, hence reducing the concentration level. However, wind speed is one factor, but the bigger factor is the wind direction. In the next section, we will see that the direction of wind is more important that how big the wind speed is for this particular external factor.
Gone with the wind, or so they hope.
Power Plants in Sofia City
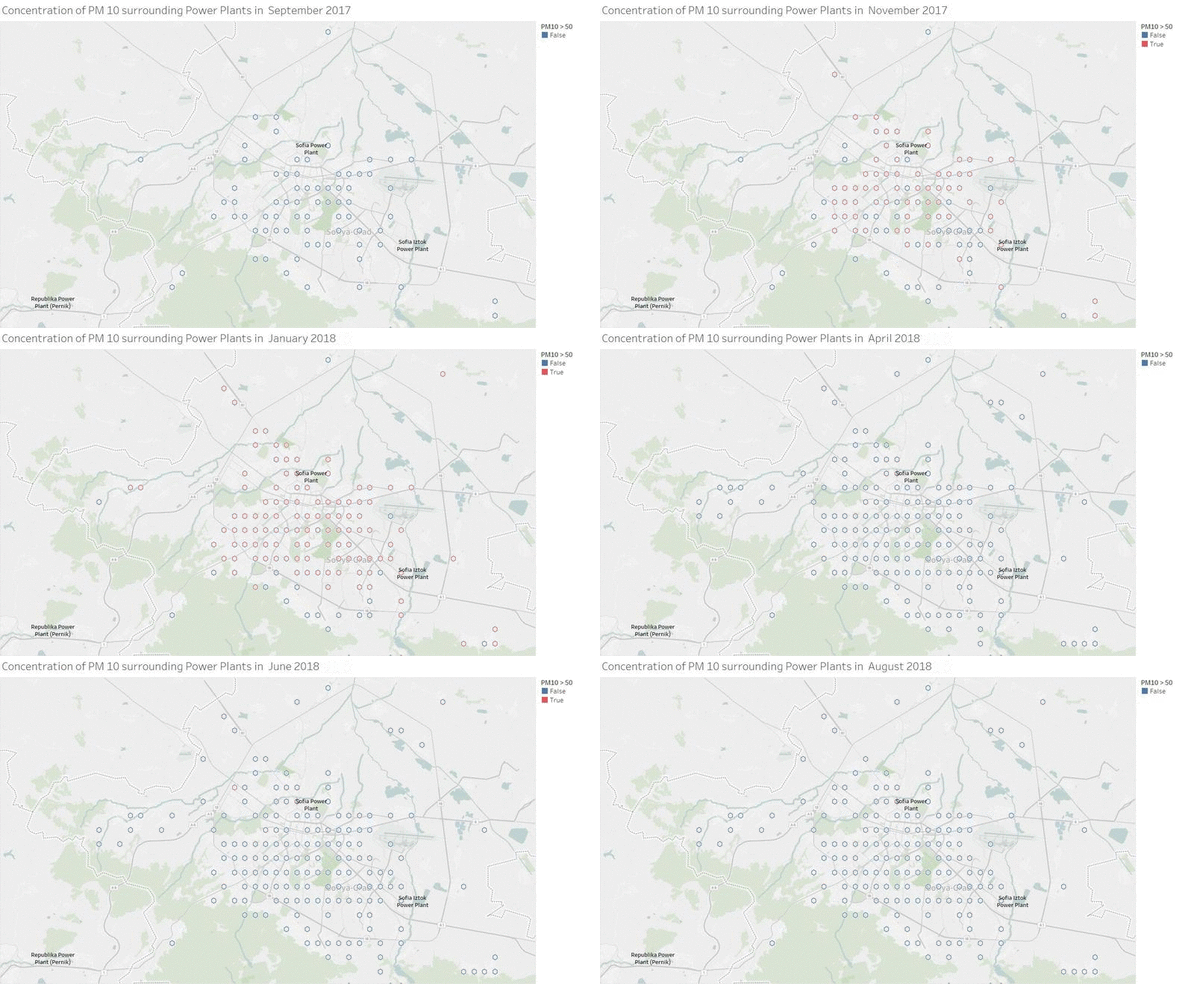
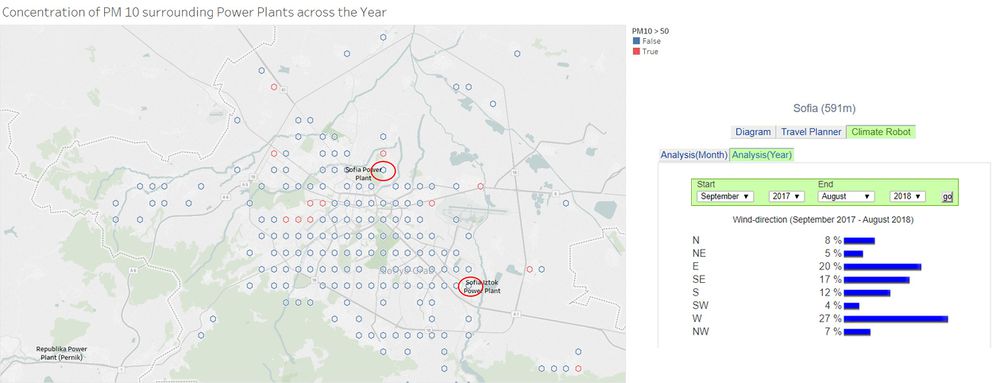
There are two operational power plants in Sofia City (Sofia Power Plant and Sofia Iztok Power Plant), and one power plant in the neighbouring city of Pernik (Republika Power Plant). Power plants burn fossil fuel to generate electricity, but produce a lot of air pollutants. Despite being the smallest two power plants in Bulgaria,they are both very old; Sofia Power Plant was commissioned in 1949 (69 years old), and Sofia Iztok Power Plant was commissioned in 1964 (54 years old). The older the power plant, the more inefficient the plant is, which means it would produce more pollutants. The image below shows the locations of the power plants mentioned. The location circled in red are the regions that constantly have high levels of air pollutants, which is demonstrated in the gif. Taking the Sofia’s City Centre as the reference, the two power plants of Sofia are located in the Northeast and Southeast quadrants. The only direction that would be beneficial to the population living in Sofia City is if the wind direction is always East. However that is only 20% of the time. In the other 80%, in whichever direction that the wind is blowing, this would blow the air pollutants into the City Centre. This could be another insight to why the pollution level within the city centre is so high.
There is another power plant just on the outskirts of Sofia City, in Pernik. This power plant is bigger in capacity than the two in Sofia. Given enough wind speed and the right wind direction, the air pollutants generated from this power plant could climb over the mountain and into Sofia City. This could possibly be a transboundary pollution.
In the movie Sound of Music, the von Trapp family had to climb a mountain to escape the Nazi. Seems like the Bulgarians have to climb over Vitosha Mountain to escape pollution.
Topology of Sofia
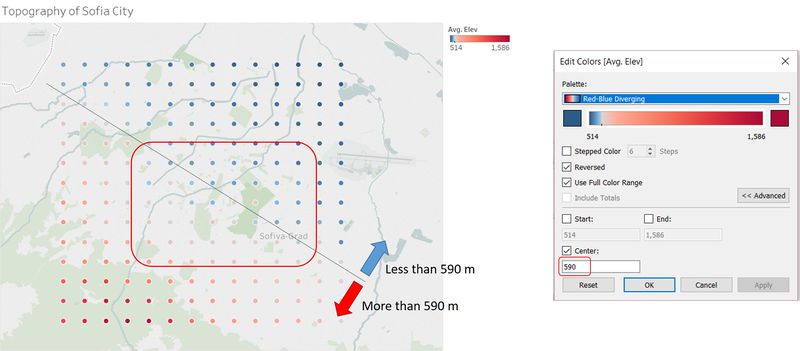
The following image shows the topography of Sofia City. The area highlighted in red is the City Centre of Sofia City. Since Sofia City stands at an altitude of 590 m, I set the colour filter to 590m. The city centre is at the foot of the mountain, and given that the wind direction is only 20% East, the city centre is caught between these two factors.
[1] Ramasamy Jayamurugan, B. Kumaravel, S. Palanivelraja, and M. P. Chockalingam, “Influence of Temperature, Relative Humidity and Seasonal Variability on Ambient Air Quality in a Coastal Urban Area,” International Journal of Atmospheric Sciences, vol. 2013, Article ID 264046, 7 pages, 2013. https://doi.org/10.1155/2013/264046.
