ISSS608 2018-19 T1 Assign Tan Le Wen Angelina Data Preparation
|
|
|
|
|
|
|
|
Data Preparation and Data Visualisation
Data Preparation
EEA Dataset
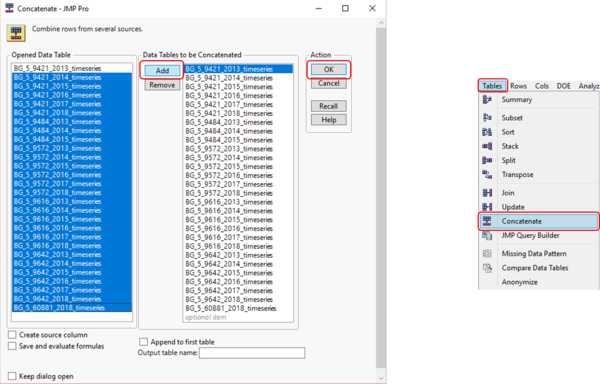
This dataset consists of 26 CSV files. The data is joined in JMPr0 14.
The data is then opened in Excel, where data preparation work was done.
- The combined file is joined together with the metadata file to get the additional information on the Air Quality Stations (altitude etc)
- Dates are grouped according to Season
- Hourly data were grouped into 3-hour block, 6-hour block for analysis
Airtube Dataset
This dataset was decoded using geohash function in R. The combined dataset is over 3 million rows, hence Excel was not able to open it. Data for 2017 and 2018 were joined using JMPro.
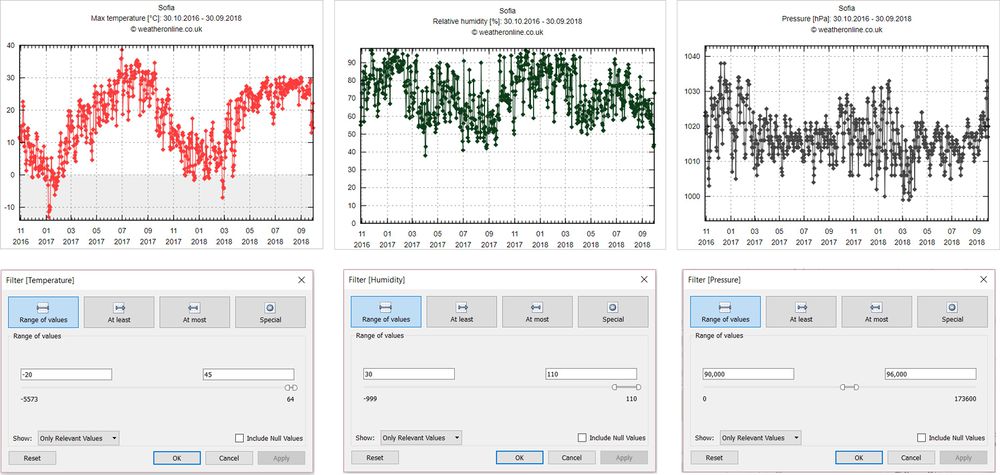
The distributions for Temperature, Humidity and Pressure were plotted in JMPro and there are some anomalies. These anomalies are being removed before I open it in Tableau to do analysis. The ranges for all three parameters are incorrect due to the some faulty sensors. The following image show the ranges for each of the parameters that the analysis for Task 2 are done in.
I chose to get the ranges from www.weatheronline.co.uk instead of using the distribution found in the meteorology dataset (weather at Sofia's Airport) as there are already some faulty sensor readings, and I am not sure whether those sensors are used to determine the parameters at Sofia's Airport. Hence I decided to use an independent source that have historical data, and I extract the data corresponding to the timeframe of the Airtube dataset.
This dataset consists of sensor readings from all over Bulgaria. The scope of the assignment is limited to only Sofia City, hence I excluded all data that do not fall within the city.
For Task 3 analysis, I have hard coded in the longitude and latitude of the 3 power plants mentioned:
- Sofia Power Plant
- Sofia Iztok Power Plant
- Pernik Republika Power Plant
Afterwhich, I used these coordinates to annotate on the map in Tableau. This is to ensure that I label the exact coordinates of the power plants.
Data Visualisation
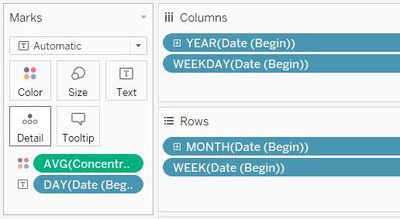
Calendar Plot:
Heat Map:
Hexbins:
