Difference between revisions of "AY1516 T2 Team Hew - Project Management"
Jump to navigation
Jump to search
| Line 29: | Line 29: | ||
== <p style="font-family:Trebuchet MS; border-left: 6px solid #daad25; padding-left:10px; line-height:40px; height:40px"><b>Deliverables </b></p>== | == <p style="font-family:Trebuchet MS; border-left: 6px solid #daad25; padding-left:10px; line-height:40px; height:40px"><b>Deliverables </b></p>== | ||
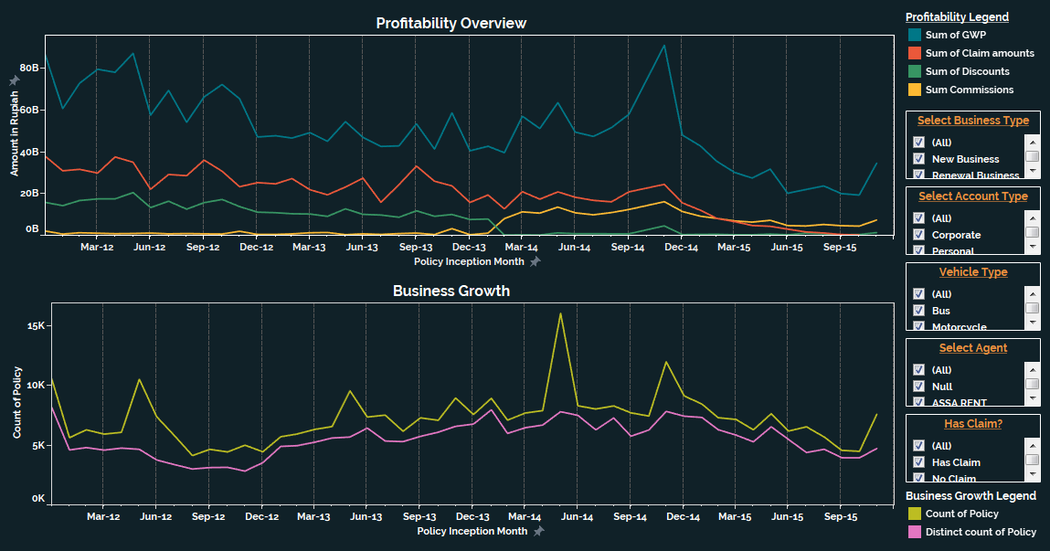
A reporting dashboard will be built in Tableau, for easy visualization of motor insurance data. Sample screenshots include: | A reporting dashboard will be built in Tableau, for easy visualization of motor insurance data. Sample screenshots include: | ||
| + | <br /><br /> | ||
| + | [[File:Main_dashboard.png|center|1050px]] | ||
<br /> | <br /> | ||
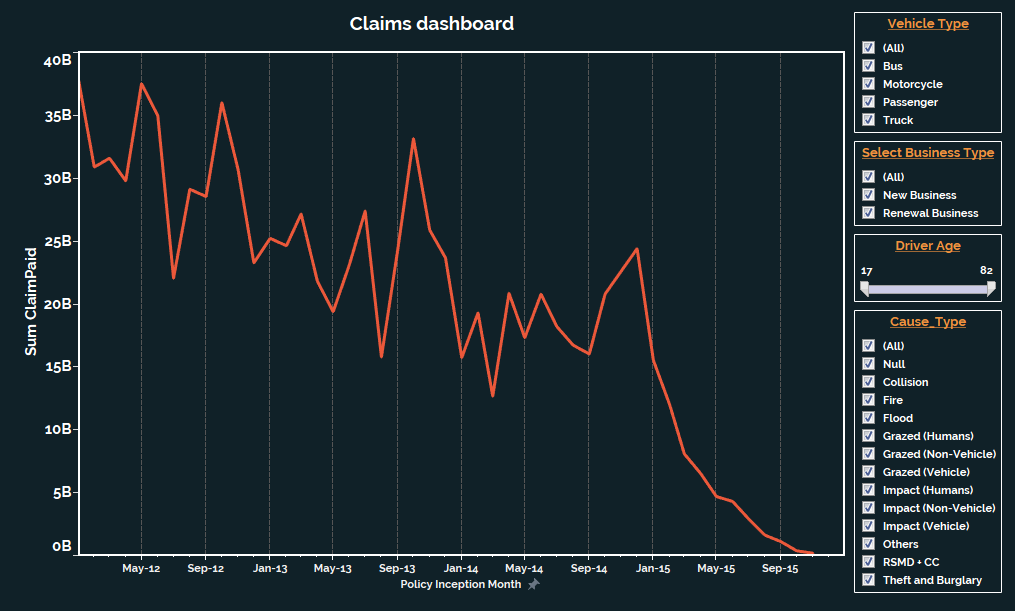
| − | + | [[File:Claims_dashboard.png|center|1050px]] | |
| − | |||
| − | [[File:Claims_dashboard.png|center| | ||
<br/><br/></div> | <br/><br/></div> | ||
Latest revision as of 14:30, 17 April 2016
Timeline

Deliverables
A reporting dashboard will be built in Tableau, for easy visualization of motor insurance data. Sample screenshots include:


Meeting Minutes
| Meeting Type | Document Links |
|---|---|
| Internal Meetings | |
| Meetings with Prof Kam | |
| Meetings with Sponsor |