ISSS608 2016-17 T1 Assign2 CHIA Yong Jian Introduction
|
|
|
|
|
|
|
2.1 Motivation
Ever since the first stock market appeared in Belgium (http://bebusinessed.com/history/history-of-the-stock-market/), the functions of stock markets have become crucial for companies to raise equity from the public, and for investors to build their capital through these stock markets (https://www.theguardian.com/sustainable-business/stock-markets-no-longer-fit-purpose).
In the United States alone, there are now three major stock exchanges - New York Stock Exchange (NYSE), National Association of Securities Dealers Automated Quotation System (NASDAQ) and American Stock Exchange (AMEX) (http://www.investopedia.com/ask/answers/08/security-market-usa.asp). These stock markets and other U.S. stock markets are among the most liquid in the world, with the first 2 quarters of 2016 seeing 8 to 10 billion shares traded (http://www.itg.com/trading-volume/quarter/).
The transparency provided by these markets allow the management, investors and lenders of listed companies to make comparison of their company with other companies in the same sector or otherwise. The insights gained from such analysis allows the various parties to make more informed decision when it comes to their risk appetites and financial planning goals, for example. The US Stocks Fundamental Data (XBRL) provided for this assignment realises about such an opportunity for interactive exploration and comparison for different stakeholders in terms of financial analysis.
2.2 Objectives
For listed companies, financial analysis can come in the form of technical (using past prices or trade volume) or fundamental analysis (measuring intrinsic value of companies) (http://www.investopedia.com/ask/answers/131.asp). The US Stocks Fundamental Data provides multiple indicators that can allow insights and fundamental analysis into the companies. For this assignment, fundamental analysis will be done. Typically, investors scrutinise the financial statements of companies to understand them better. These financial statements include:
- Balance Sheet - Snapshots of the company's accounts (assets, liabilities and shareholders' equity)
- Income Statement - Understanding the profit/loss made by a company during a reported period
- Cash Flow Statement - Company's sources and uses of cash
- Statement of changes in shareholders' equity - Shows movement of equity
Understanding these financial statements can be a big endeavour by itself, especially for non-experienced stakeholders. Visual analytics can come in to support decision making (or sense making) and allow stakeholders to spot areas that are interesting.
Instead of forming visualisations by financial statements, the objectives of the analysis will be to target specific crowds and some crucial ratios they need to know. They are:
- Company Management - Includes the C-level executives and senior management. Responsible for the strategic direction and oversight of the company
- Shareholders - Owners of a company, who both take part in the success and failure of the company via its stock price
- Bondholders - They are lenders of the company. Through financial instruments like bonds and loans, the bondholders lend money to the company where the company will have an obligation to pay back the loan in the specified terms.
For each stakeholder, various analysis will be explored. These are described below:
2.2.1 Company Management
The management are interested to know how profitable is the company, and how the assets are being managed. The following indicators will be looked into:
| Category | Indicators |
|---|---|
| Profitability and Operations Analysis | Gross Margin Ratio, Profit Margin Ratio |
| Asset Management | Asset Turnover Ratio |
Shareholders would want the "best bang for the buck", whether the company they are invested in creates the most value from each dollar they put in:
| Category | Indicators |
|---|---|
| Profitability | Return on Equity |
| Disposition of Earnings | Dividends Per Share, Dividends Cover |
2.2.3 Bondholders
Bondholders will be largely concerned over the company's ability to service their debts, and how much they have leveraged:
| Category | Indicators |
|---|---|
| Liquidity Ratios | Current Ratio, Quick Ratio, Operating Cash Flow |
2.3 Data Visualization Process
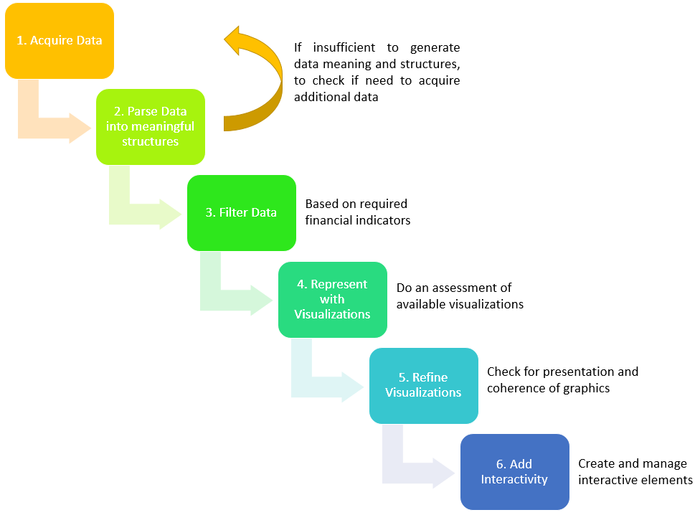
The following process is an adaptation and application of Ben Fry's Data Visualization process (https://www.dashingd3js.com/the-data-visualization-process):
Take note that in the original visualization process, there is a "mining" step after Data Filtering. For purpose of this assignment, detailed statistical analysis will not be done, nonetheless, appropriate statistical methods will be performed if necessary.
