ISSS608 2016-17 T1 Assign2 CHIA Yong Jian - Data Preparations
|
|
|
|
|
|
|
3.1 Data Sources
The following data sources are used either directly as part of the visualisation, or for reference:
| No. | Filename | Description | Source |
|---|---|---|---|
| 1 | indicators_by_company.csv | Provides the core information of indicators as reported by companies to the U.S. Securities and Exchange Commission | https://www.kaggle.com/usfundamentals/us-stocks-fundamentals |
| 2 | companies.csv | Provides the mapping of the company name to the company ID | https://www.kaggle.com/usfundamentals/us-stocks-fundamentals |
| 3 | companies-names-industries.csv | Provides the NAICS industry sector (http://www.census.gov/eos/www/naics/) information for each company | http://usfundamentals.com/ |
| 4 | Taxonomy_2016.xlsx | Provides verbose information on labels | http://www.fasb.org/jsp/FASB/Page/SectionPage&cid=1176164335312 |
3.2 Analysis of Data Sources
Using JMP Pro, we can analyse the following details of the main data set (indicators_by_company.csv):
| Column | Observations |
|---|---|
| company_id | There are 9619 unique companies present in the dataset. However, the number of indicators available per company across the years varies. |
| indicator_id | There are 8529 available indicators. However, not all indicators have sufficient coverage across the companies. |
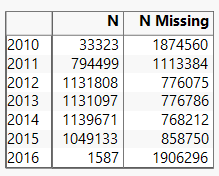
| 2010 2011 2012 2013 2014 2015 2016 |
The number of values available per year varies. However 2010 and 2016 seem to have majority of missing values. |
Based on the above observations, missing data could be a concern in analysing companies across the same industry. However, for purpose of this assignment, a decision will not be made to exclude data as it might be useful for some stakeholders even if some companies only have partial values.
3.3 Data Preparation Performed
The main steps performed to get the data ready are:
- Parsing Data - Forming relationships between the different data sources
- Filter Data - Knowing what needs to be retrieved at the end
- Final Dataset - Steps performed in JMP Pro/Tableau to get the dataset ready for visualisations
3.3.1 Parsing Data
Based on the data sources, the relationships between the files are as follows:
The master data file is the "indicators_by_company" file, with company name and industry information joined from other files. For the taxonomy file, it will be used as information only, as some indicators in the master file did not match up with a label in the taxonomy file. Fields highlighted will be used in reaching the final state of the data for visualisations.
3.3.2 Filter Data
Due to the size of the dataset, a retrieval of only necessary indicators was done to calculate the ratios (as described in Objectives) are performed:
Company Management
| Ratio | Formula | Equivalent Indicators in dataset |
|---|---|---|
| Profit Margin Ratio | Net Income ÷ Net Sales (Revenue) | ProfitLoss ÷ Revenues |
| Asset Turnover Ratio | Revenues ÷ Total Assets | Revenues ÷ Assets |
| Return on Assets Ratio | Net Income ÷ Total Assets | NetIncomeLoss ÷ Assets |
Shareholders
| Ratio | Formula | Equivalent Indicators in dataset |
|---|---|---|
| Return on Equity Ratio | Net Income ÷ Shareholders' Equity | NetIncomeLoss ÷ StockholdersEquity |
| Dividends Coverage Ratio | Profit after tax ÷ Total dividends paid | ProfitLoss ÷ Dividends |
| Price-Earnings Ratio | Market Value per Share ÷ Earnings per Share | SharePrice ÷ EarningsPerShareBasic |
Bondholders
| Ratio | Formula | Equivalent Indicators in dataset |
|---|---|---|
| Current Ratio | Current Assets ÷ Current Liabilities | AssetsCurrent ÷ LiabilitiesCurrent |
| Debt-to-Equity Ratio | Total Liabilities ÷ Shareholders' Equity | Liabilities ÷ StockholdersEquity |
| Interest Coverage Ratio | (Net income + Interest Expense + Tax Expense) ÷ Interest Expense | (NetIncomeLoss + InterestExpense + IncomeTaxExpenseBenefit) ÷ InterestExpense |
3.3.3 Final Dataset
To get to the final dataset used for visualisations, the following is performed:
Using JMP Pro 12
- Extract only indicators necessary to calculate the ratios.
- Perform a transpose of the indicators and the years columns. I.e. the indicators are now columns and the years became rows.
- Create new columns in the ratio calculations
Note that a distribution analysis of the ratio columns revealed that there are some outlier values (See example screenshot below). For purpose of this assignment, these values will not be removed as further investigation might be needed in each case to ascertain if the data is valid or not.
Using Tableau
- Import the prepared file from JMP Pro. Filter away raw indicators. This is done deliberately to reduce dimensions for interactive filtering later.
- Left join the company name and industry to the prepared file.
- Pivot the Ratios columns
- A calculated field was created to format the Year column as a date. Formula used: MAKEDATE([YearText],1,1)
Final Dataset
The final dataset prepared have the following columns that will be used in the dashboards:
- Company Name
- NAICS Industry Sector
- Year
- Indicator
- Value


