ISSS608 2016-17 T1 Assign2 CHIA Yong Jian - Results
Jump to navigation
Jump to search
|
|
|
|
|
|
|
5.1 A practical example of how the dashboards can be used
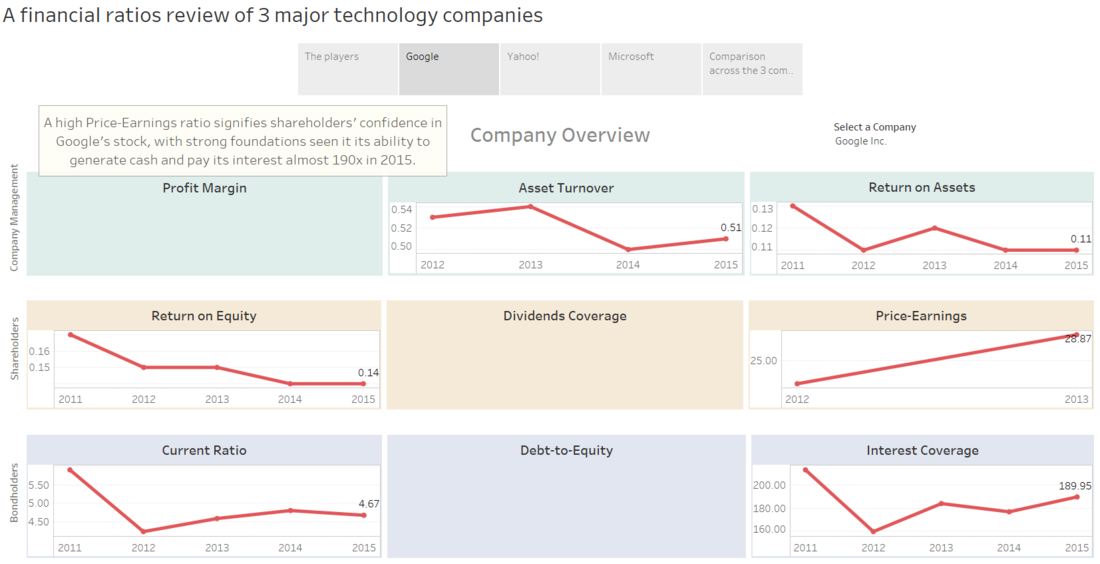
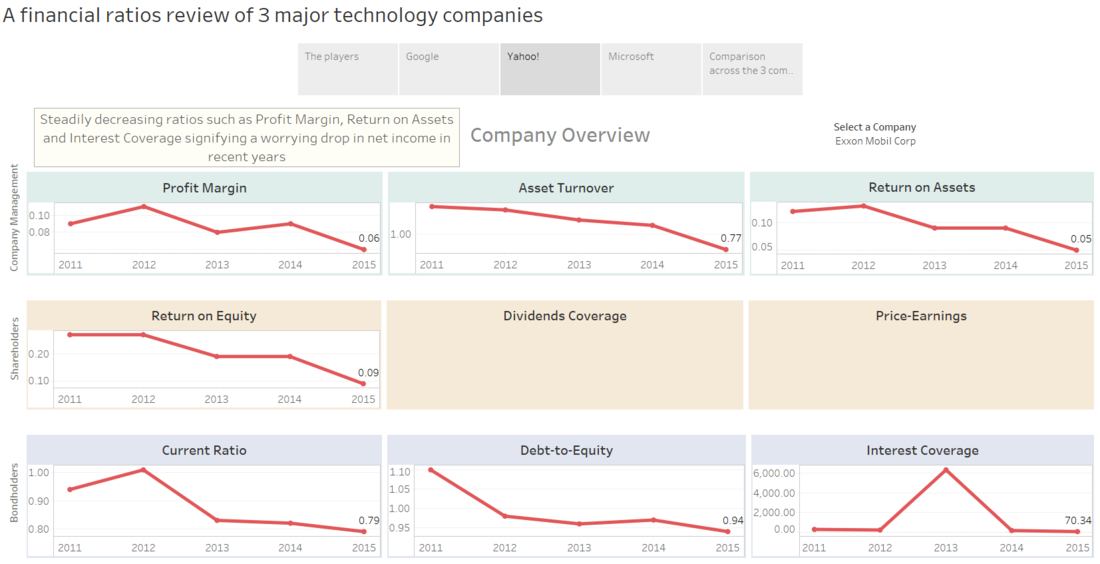
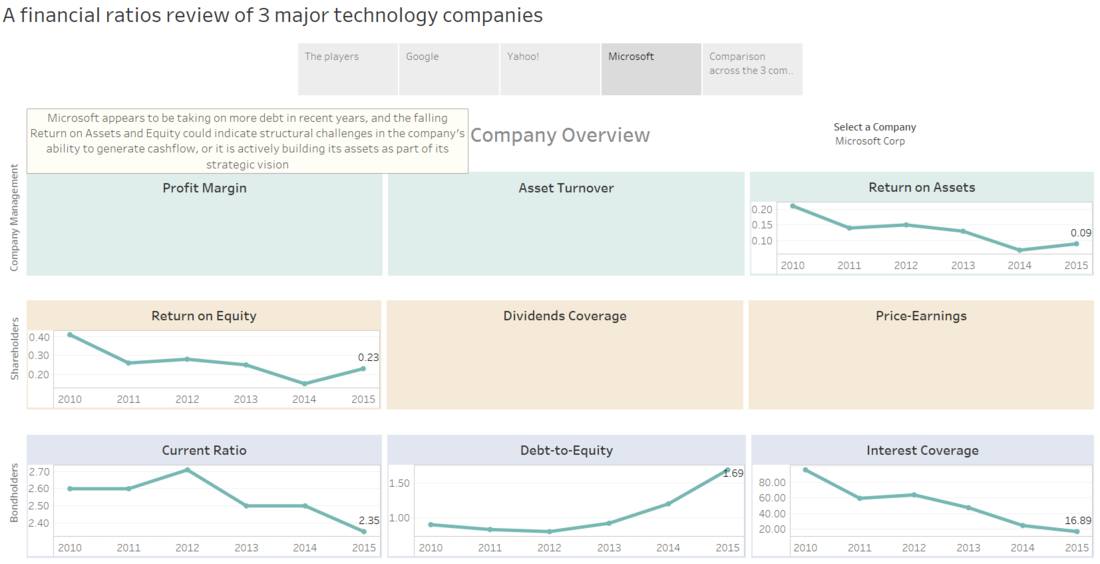
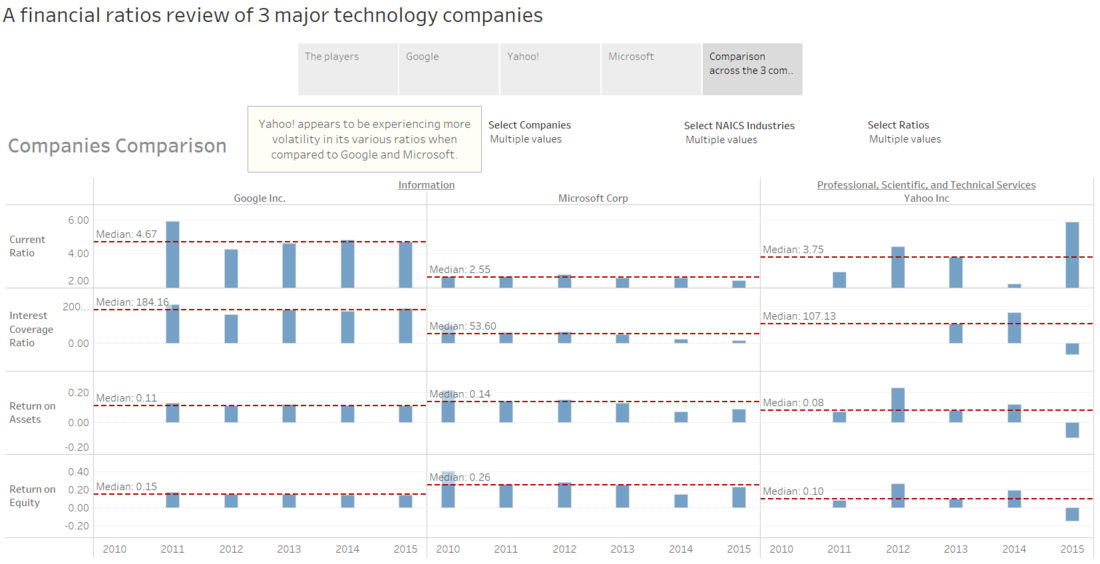
Using Tableau, a Storyboard could be created to tell a story. Here, 3 technology companies was used as an example to illustrate the simplicity of using the dashboards to make quick observations about the state of the companies.
Link to Storyboard
For convenience, the main pages of the storyboard are as follows:
| No. | Story Page |
|---|---|
| 1 | |
| 2 | |
| 3 | |
| 4 | |
| 5 |
