ISSS608 2016-17 T1 Assign2 Ong Han Ying - Results Vers4 ResearchPaper
|
|
|
|
|
|
|
|
|
|
|
|
|
|
|
7.4 Objective 2: Version#4 - Research Paper Review
In all, for objective 2; we aim to compare the results from visual analytics with that from the statistics analysis, as per the research paper. Our of the 9 hypothesis defines in the paper, we have randomly chosen the following hypothesis to do our comparsions and analysis. The objective of doing so is the help the stakeholders to unearth further insights of the factors that affected if Wikipedia can be used as a teaching tool.
The 3 selected hypotheses selected as below;
- H2b:The behavioral intention of using Wikipedia by teachers is directly influenced by their perception about the social image of Wikipedia.
- H4: The perceived enjoyment of Wikipedia determines its perceived ease of use.
- H7a: The teachers that have a 2.0 profile are those who have a positive sharing attitude.
Note: the other hypotheses are still available on the dashboard for reader to compare and analysis.
7.4.1: H2b - Behavior Intention vs Social Image
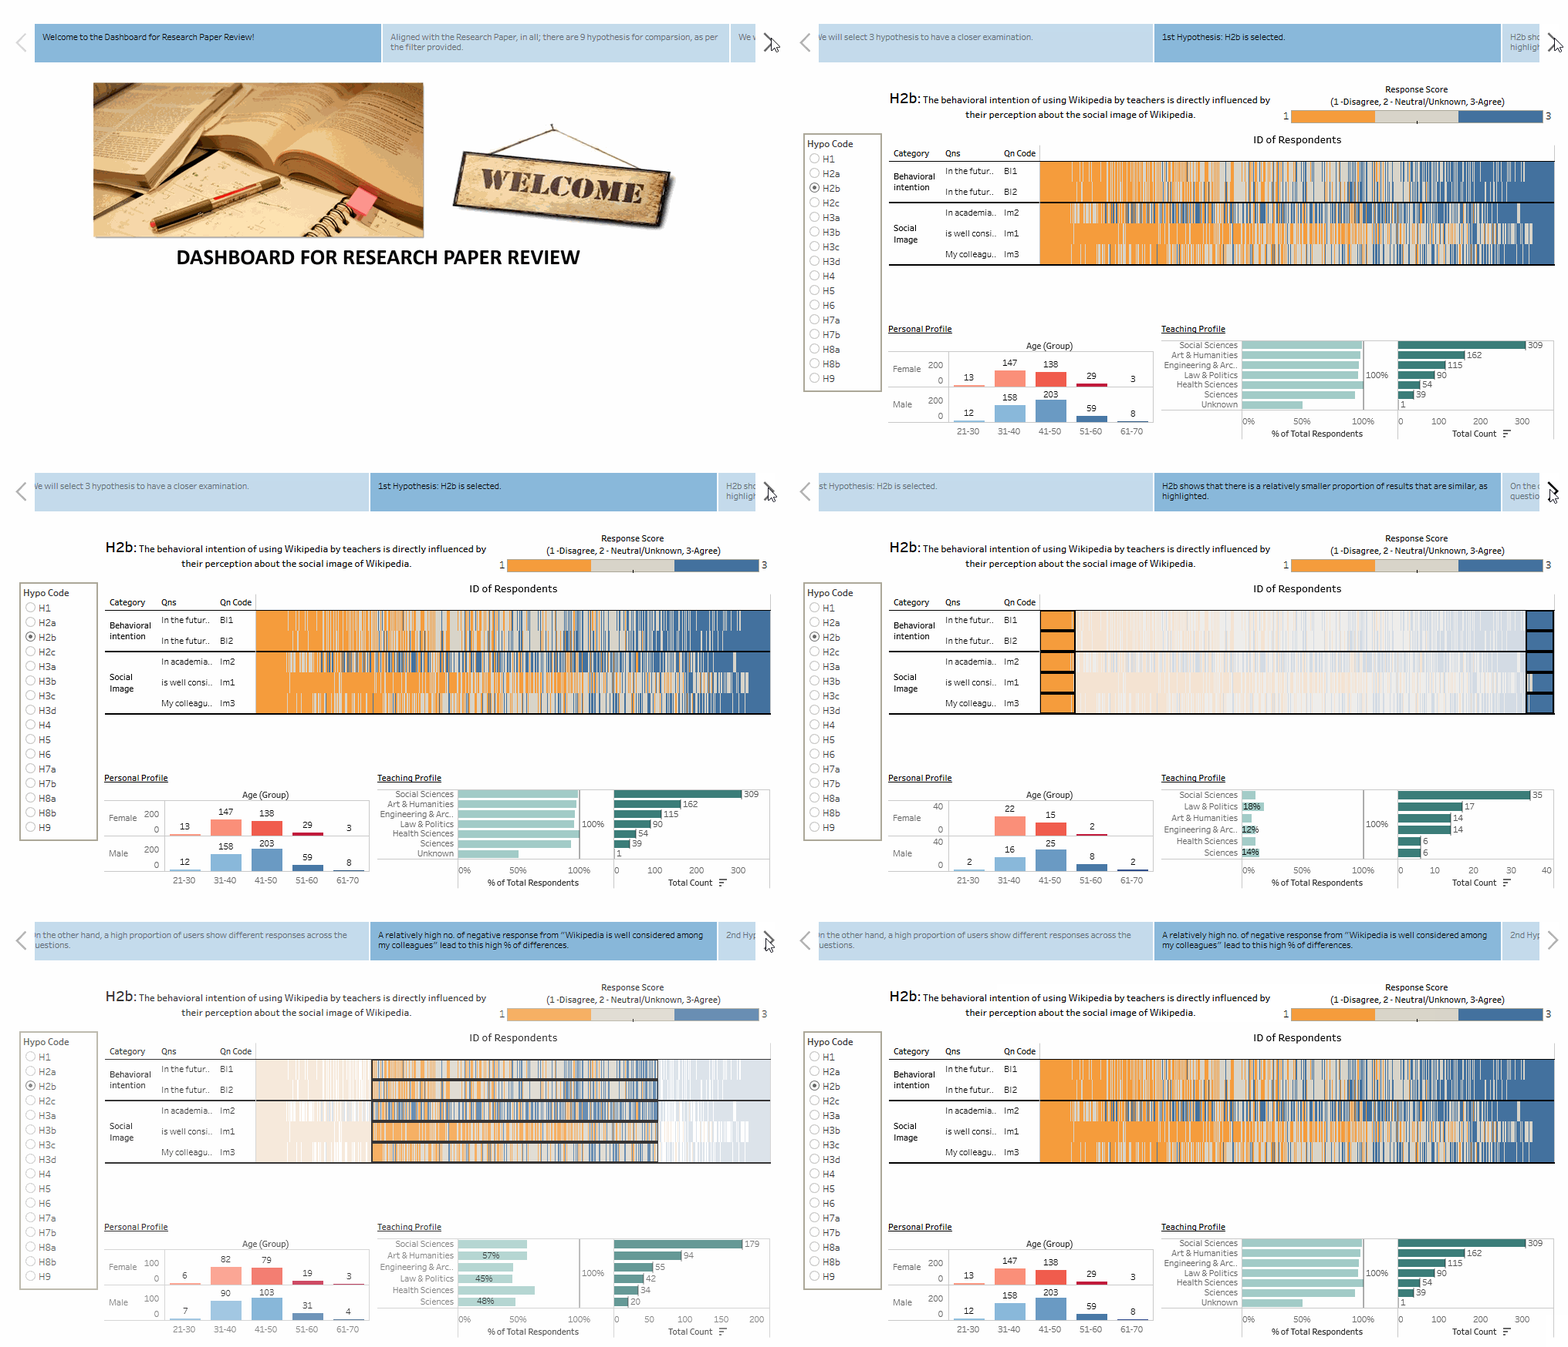
The first hypothesis chosen to do our comparison is H2b: The behavioral intention of using Wikipedia by teachers is directly influenced by their perception about the social image of Wikipedia.
In the research paper, this hypothesis is accepted and therefore, showing that both factor of "behavior intention" and "Social Image" are positively correlated.
However, in our visual analytics, we can see that;
- There is a relatively smaller proportion of results that are similar.
- On the other hand, a high proportion of users show different responses across the questions.
- A relatively high no. of negative response from "Wikipedia is well considered among my colleagues" lead to this high % of differences.
The following are also illustrated below;
7.4.2: H4 - Perceived Enjoyment vs Perceived Ease of Use
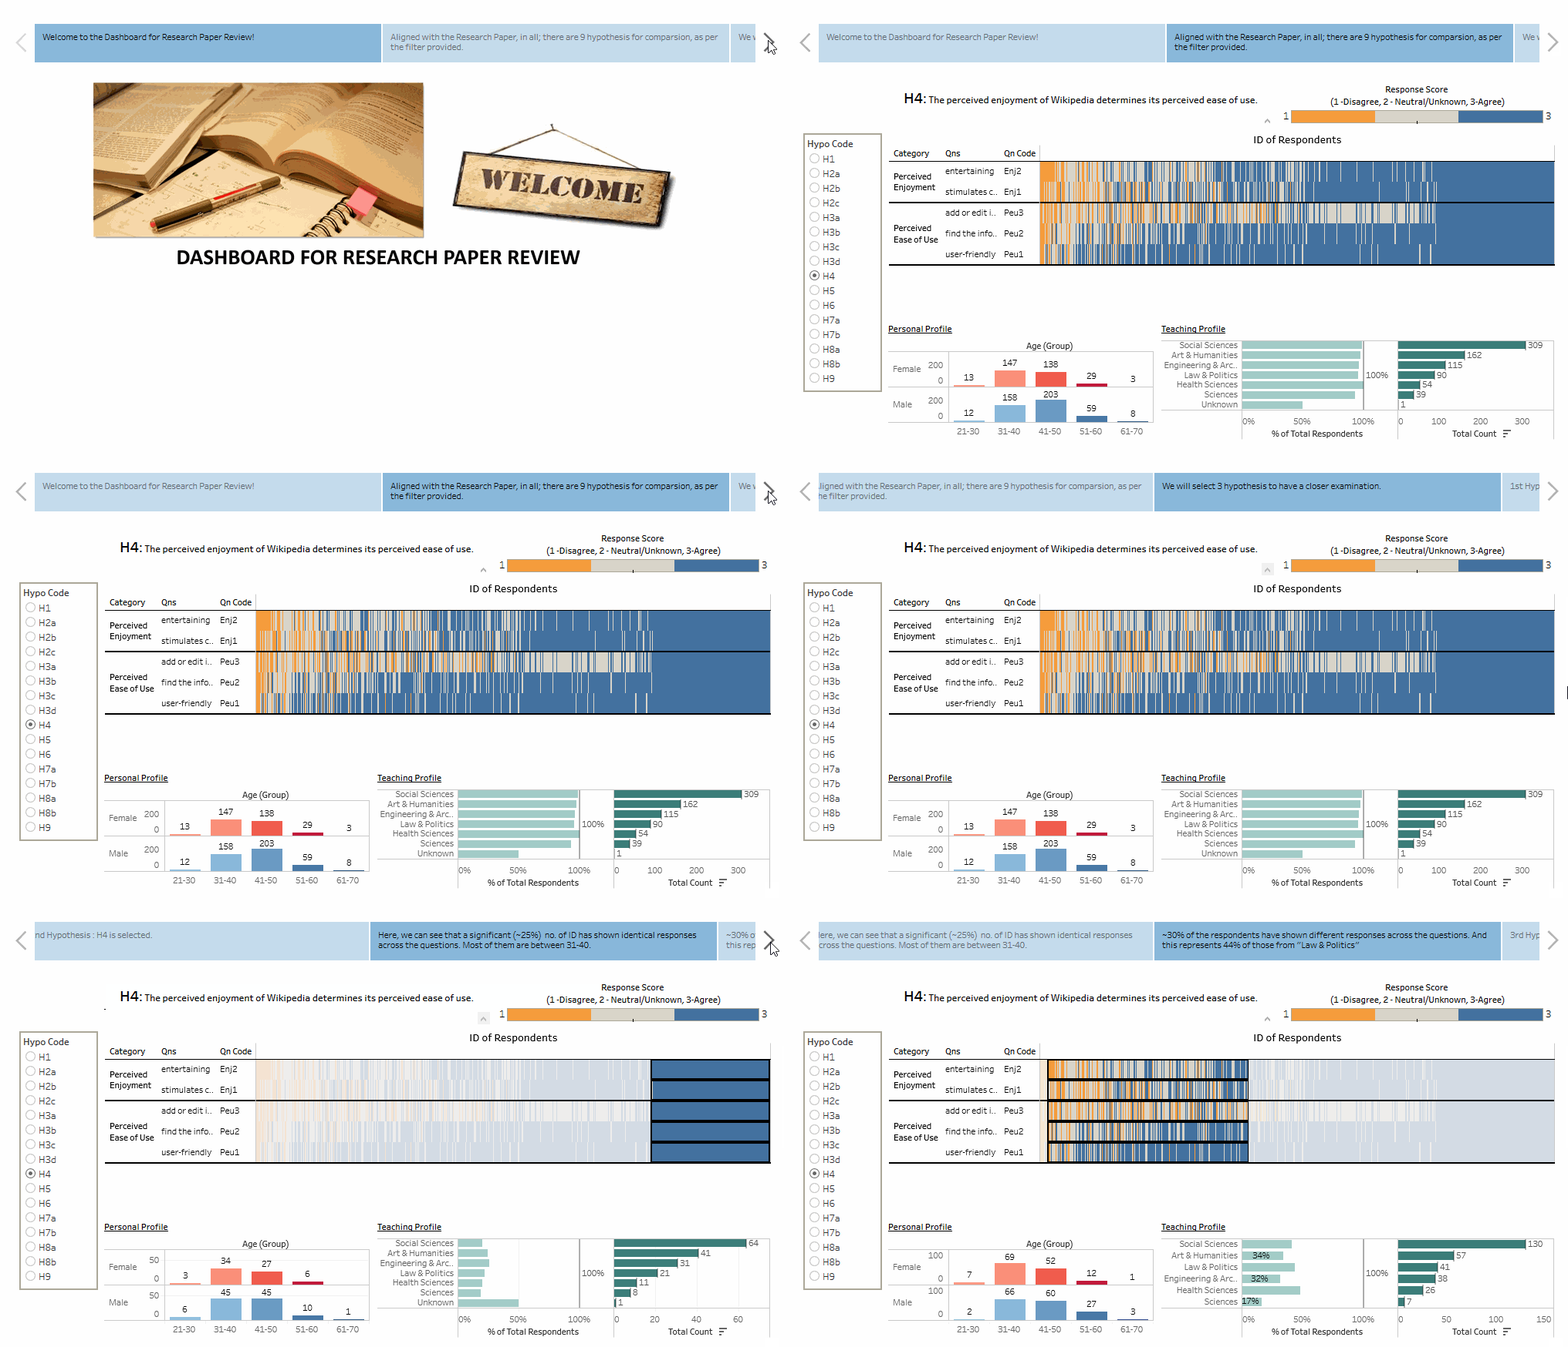
The 2nd hypothesis chosen to do our comparison is H4: The perceived enjoyment of Wikipedia determines its perceived ease of use.
In the research paper, this hypothesis is accepted and therefore, showing that both factor of "percieved enjoyment" and "perceived ease of use" are positively correlated.
However, in our visual analytics, we can see that;
- Overall, most of the responses are in blue (agree/strongly agree) or grey (neutral/unknown).
- Here, we can see that a significant (~25%) no. of ID has shown identical responses across the questions.
- ~30% of the respondents have shown different responses across the questions. And this represents 44% of those from "Law & Politics"
The following are also illustrated below;
7.4.3: H7a - 2.0 Profile vs Positive Sharing Attitude
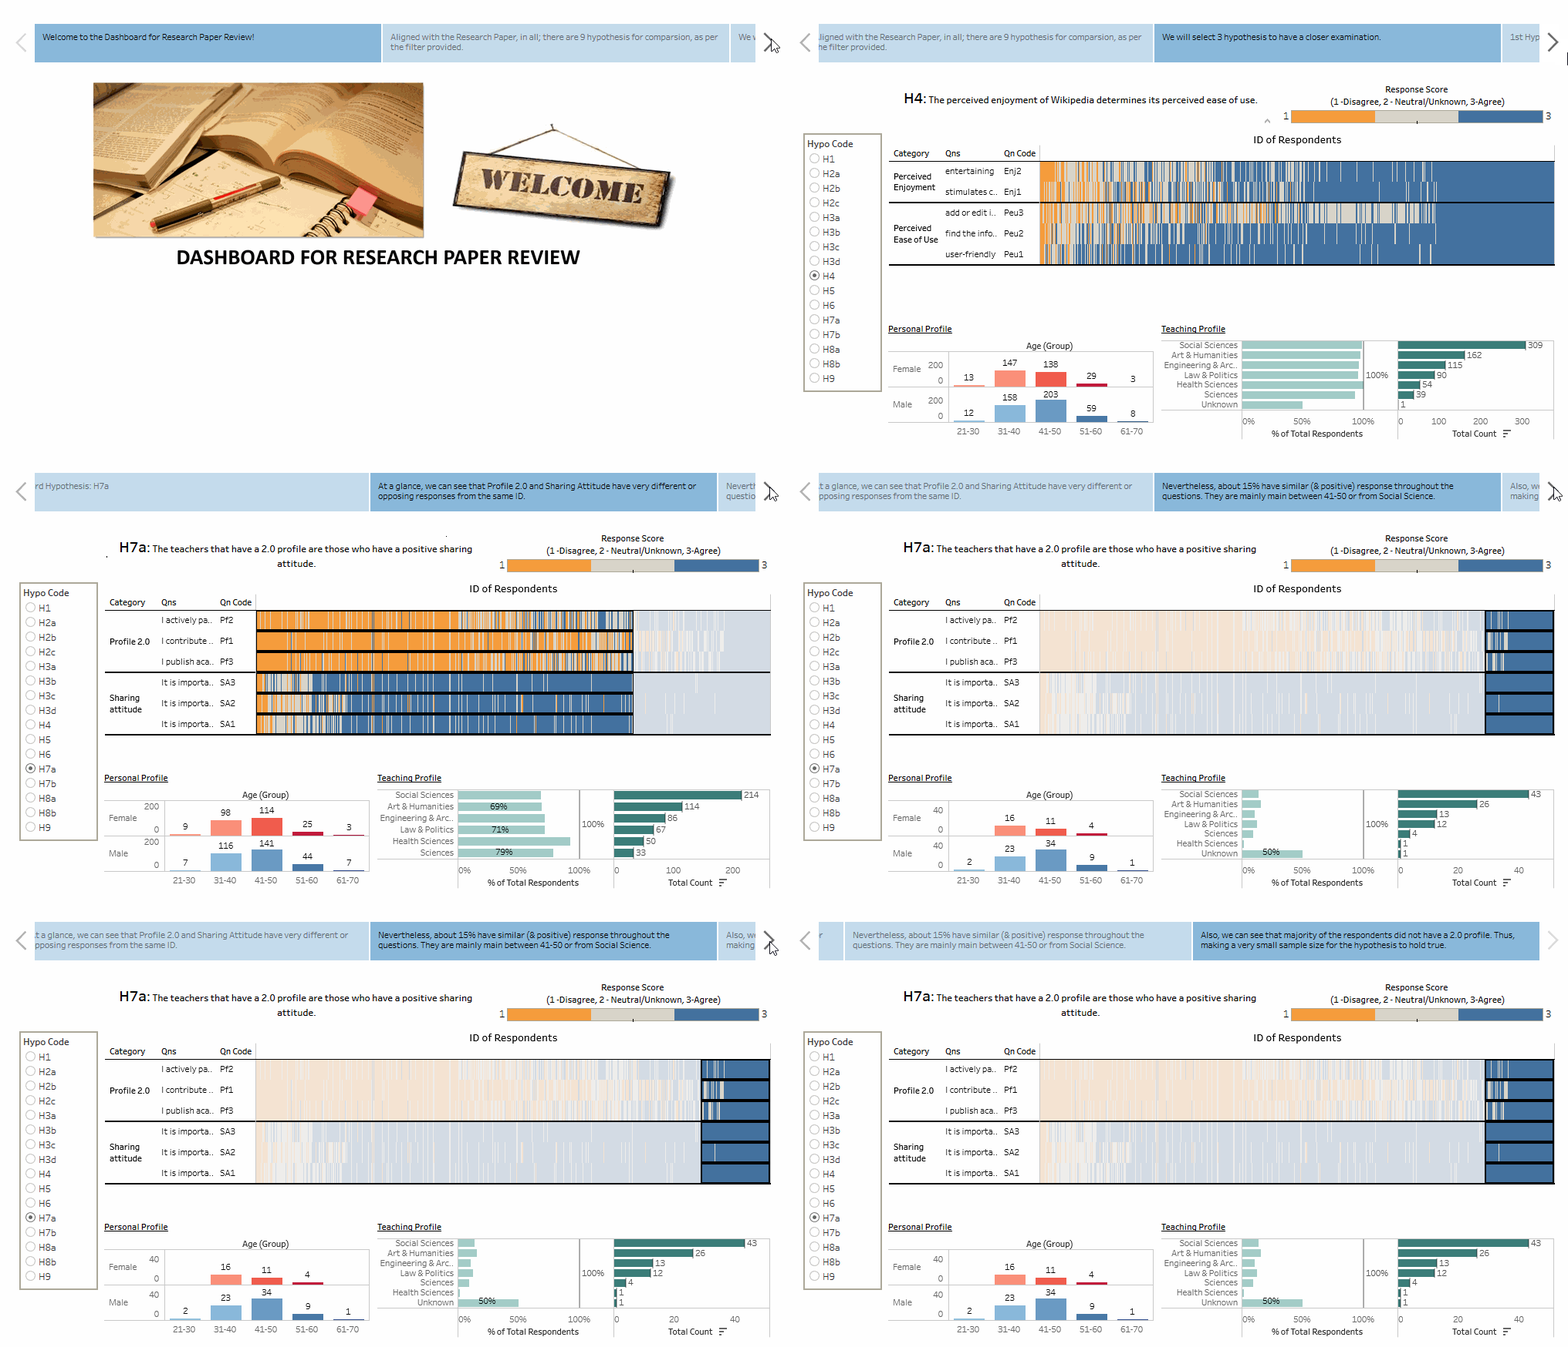
The 3rd hypothesis chosen to do our comparison is H7a: The teachers that have a 2.0 profile are those who have a positive sharing attitude.
In the research paper, this hypothesis is accepted and therefore, showing that both factor of "2.0 Profile" and "positive sharing attitude" are positively correlated.
However, in our visual analytics, we can see that;
- At a glance, we can see that Profile 2.0 and Sharing Attitude have very different or opposing responses from the same ID.
- Nevertheless, about 15% have similar (& positive) response throughout the questions. They are mainly main between 41-50 or from Social Science.
- Also, we can see that majority of the respondents did not have a 2.0 profile. Thus, making a very small sample size for the hypothesis to hold true.
The following are also illustrated below;
7.4.4 Overall Storyboard
Both the dashboard and the storyboard can be found in the following link:
- The link to the storyboard at Tableau Public--> [HERE]
- The link to the dashboard at Tableau Public--> [HERE]
- Link to Assignment's Website -->Here in GitHub
Note: Please use Firefox browser to open the link for storyboard, if the above link did not work on Chrome and Internet Explorer. Alternatively, you can download the workbook and view the storyboard offline.


