 ISSS608 2016-17 Assignment 2 - Ong Han Ying
7.5: Putting the Analysis Together
7.5.1: Objective 1 - For the Stakeholders
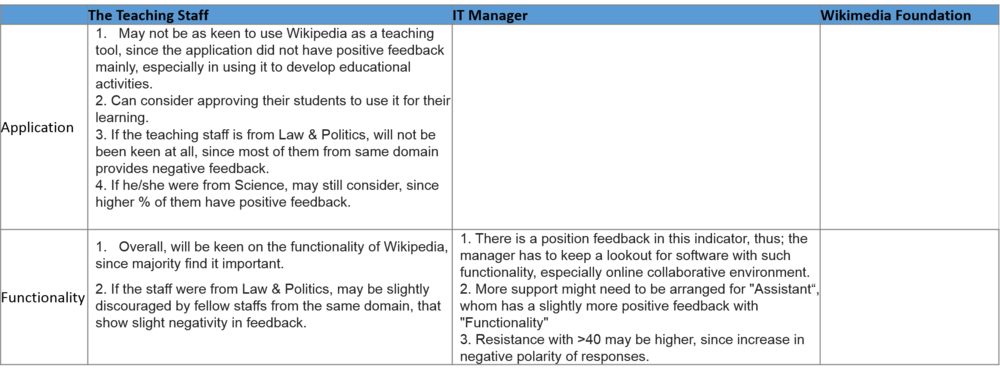
In all, we have placed all the analysis as below, and their likely decisions as below;
7.5.2: Objective 2 - Research Paper Review
In all, we can see that while in the paper that all the hypothesis has been accepted, however; a sample of 3 hypothesis has shown that it may not applied to most of the respondents. In fact,
- In all the 3 cases, it applied only to <=30% of the respondents whom did the survey.
- Further filtering will show that it applied to certain % of the teaching & personal profile only.
Therefore, there is a difference between the results from visual analytics, as compare to those from statistics means.


