ISSS608 2016-17 T1 Assign2 Ong Han Ying - Results Vers2 IT Manager
Jump to navigation
Jump to search
|
|
|
|
|
|
|
|
|
|
|
|
|
|
|
| CONTENT |
|---|
|
7.2 Objective 1: Version#2 - The IT Manager |
7.2 Objective 1: Version#2 - The IT Manager
In all, there are 3 indicators that interest the IT Manager. In this section, we will stand in the position of an IT Manager and follow through how will an IT Manager will use and analyze the Dashboard.
7.2.1 Functionality
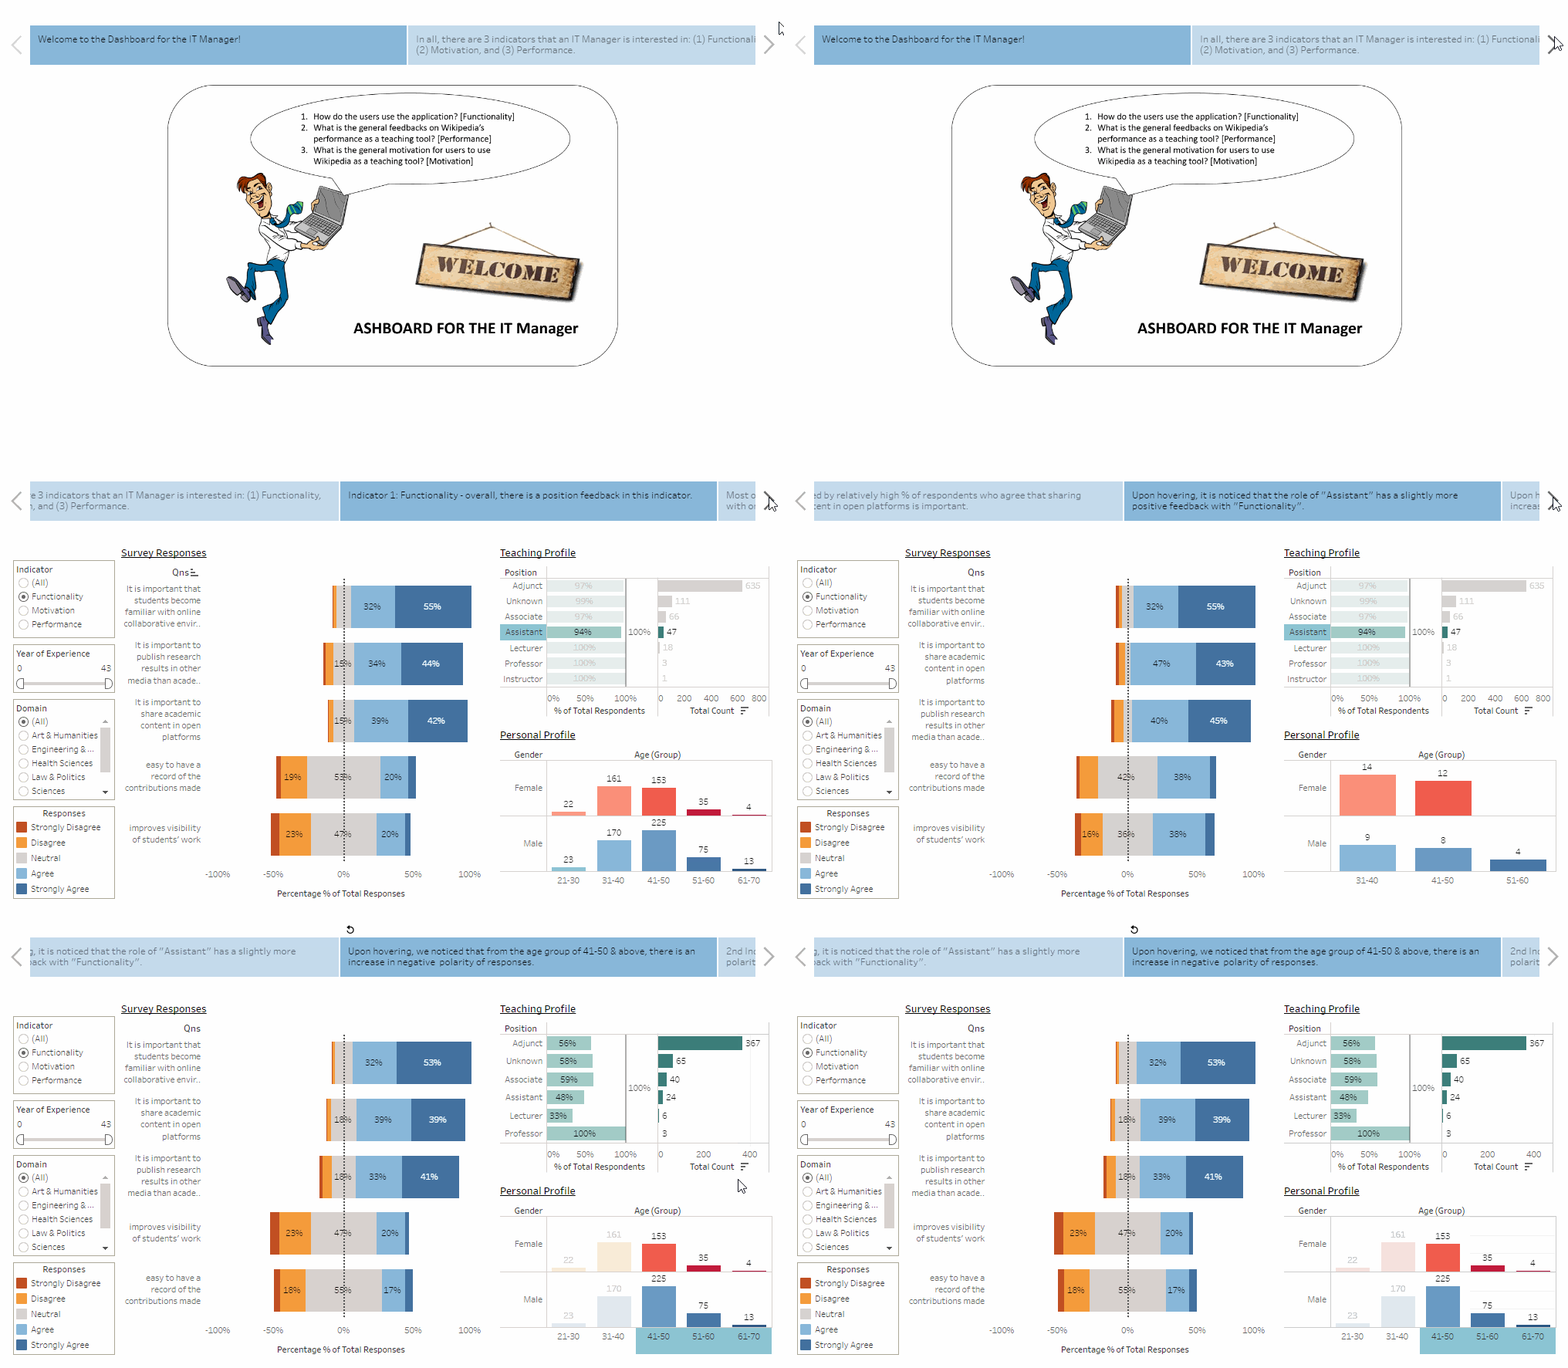
In all, in the area of "Functionality",
- Overall, there is a position feedback in this indicator.
- Most of the respondents agree that it is important for the student to be familiar with the online collaborative environment.
- Relatively high % of respondents agree that sharing academic content in open platforms is important.
- It is noticed that the role of "Assistant" has a slightly more positive feedback with "Functionality"
- Also, from the age group of 41-50 & above; there is an increase in negative polarity of responses.
The following are also illustrated below;
7.2.2 Motivation
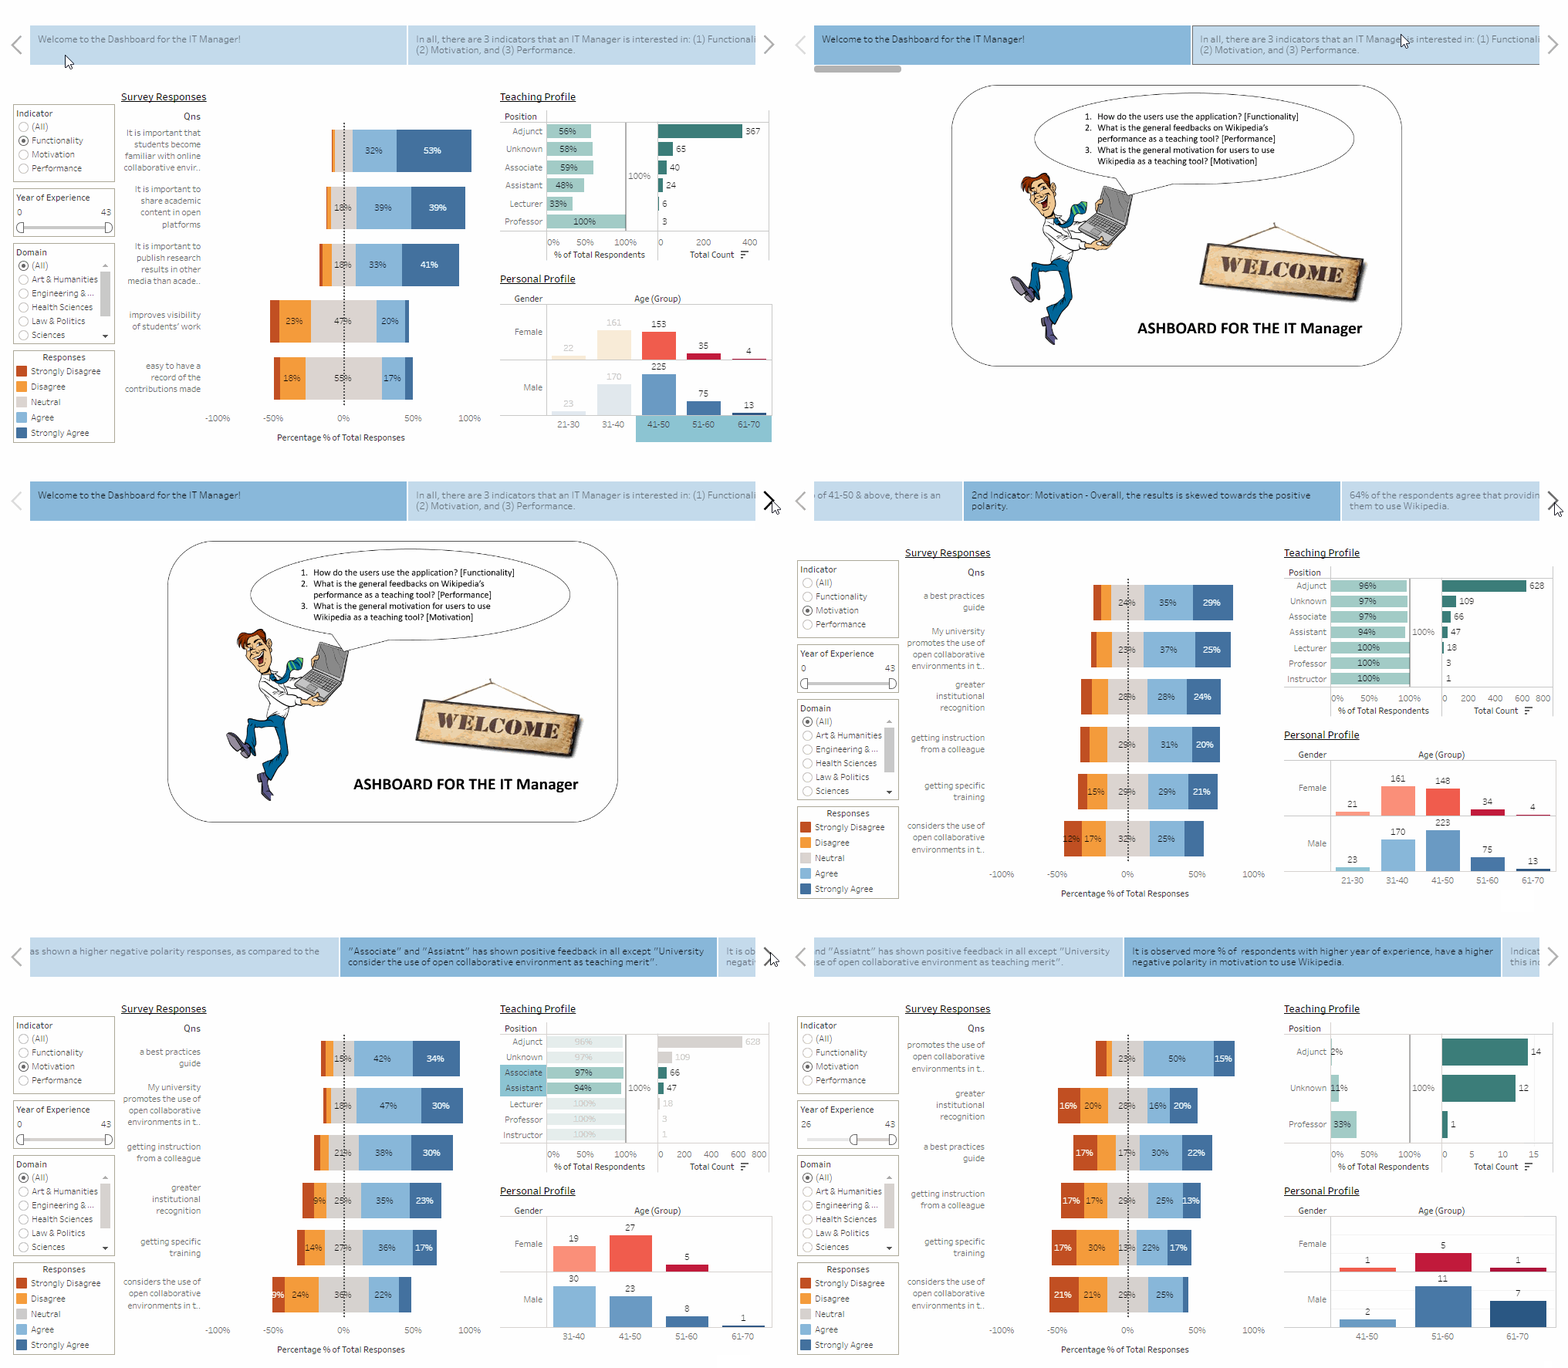
In all, in the area of "Motivation",
- Overall, the results is skewed towards the positive polarity.
- 64% of the respondents agree that providing a best practice guide will motivate them to use Wikipedia.
- "Unknown" has shown a higher negative polarity responses, as compared to the others.
- "Associate" and "Assistant" has shown positive feedback in all except "University consider the use of the open collaborative environment as teaching merit".
- It is observed more % of respondents with a higher year of experience, have a higher negative polarity in motivation to use Wikipedia.
The following are also illustrated below;
7.2.3 Performance
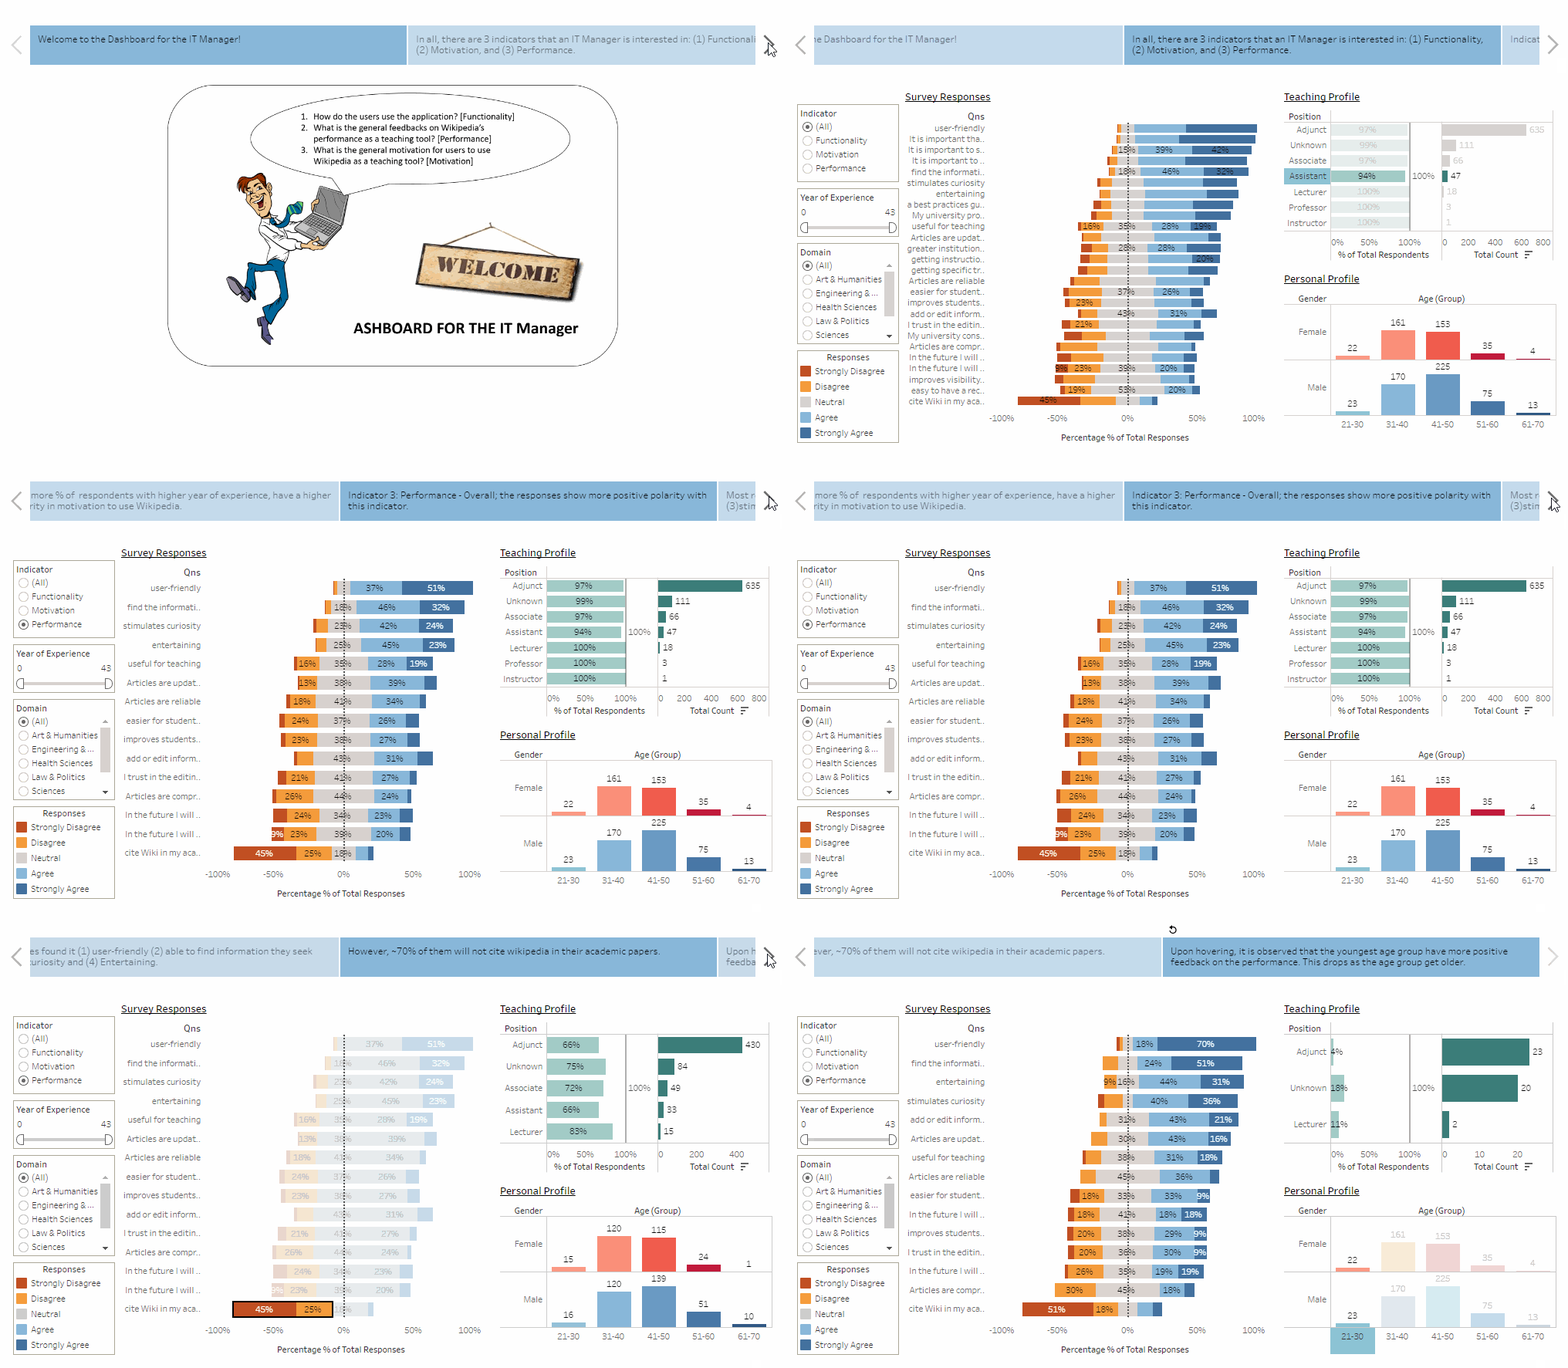
In all, in the area of "Performance",
- Overall; the responses show more positive polarity with this indicator.
- Most responses found it (1) user-friendly (2) able to find the information they seek (3)stimulate curiosity and (4) Entertaining.
- However, ~70% of them will not cite Wikipedia in their academic papers.
- Upon hovering, it is observed that the youngest age group have more positive feedback on the performance. This drops as the age group gets older.
The following are also illustrated below;
7.2.4 Overall Storyboard
Both the dashboard and the storyboard can be found in the following link:
- The link to the storyboard at Tableau Public--> [HERE]
- The link to the dashboard at Tableau Public--> [HERE]
- Link to Assignment's Website -->Here in GitHub


