Click here to return to AY16/17 T2 Group List

Multiple Linear Regression Model
What makes a good Facebook post? This section outlines the explanatory model on the article dataset from Facebook Insights supplemented with our crawled variables to form a holistic complete article dataset.
Response / Dependent Variables
We choose to make use of “Total Engagement” as the response/ dependent variable. “Total Engagement” for each post is the sum of the total number of reactions (like, love, wow, haha, angry, sad), comments and shares of that post as of the data retrieval date. Reactions are similar to the ‘likes’ on Facebook, but provides the additional option of reacting with five animated emoji rather than a simple ‘like’ reaction.
Other possible response variables include the comment sentiment score measures, and individual engagement metrics but they are ruled out due to reasons such as their non-normal distribution and utility for our sponsor.
Explanatory / Independent Variables
Article Dataset Metadata for Analysis
| Header
|
Description
|
| Post Message Sentiment |
Crawled Variable: Sentiment Score calculated using PyCharm python script, AFINN Sentiment words and emoji package
|
| Article Text Sentiment |
Derived Variable: Sentiment Score calculated using PyCharm python script, AFINN Sentiment words and emoji package
|
| Number of Images |
Crawled Variable: Number of Images in the article
|
| Number of Videos |
Crawled Variable: Number of Videos in the article
|
| Number of Links |
Crawled Variable: The number of embedded links in the article
|
| Number of syllables |
Crawled Variable: number of syllables within text
|
| Word count |
Crawled Variable: Total word count
|
| Sentence count |
Crawled Variable: Total sentence count
|
| Words per Sentence |
Crawled Variable: Number of words/sentence in the body of text
|
| Flesch reading ease |
Crawled Variable: Readability Index value of Flesch Reading Ease
|
| Flesch kincaid grade |
Crawled Variable: Readability Index value of Flesch kincaid grade
|
| Gunning fog |
Crawled Variable: Readability Index value of Gunning fog
|
| Smog index |
Crawled Variable: Readability Index value of Smog index
|
| Automated readability index |
Crawled Variable: Readability Index value of Automated readability index
|
| Coleman liau index |
Crawled Variable: Readability Index value of Coleman liau index
|
| Linsear write formula |
Crawled Variable: Readability Index value of Linsear write formula
|
| Dale chall readability score |
Crawled Variable: Readability Index value of Dale chall readability score
|
| Difficult words count |
Crawled Variable: Total count of difficult words
|
| Article Category |
Crawled Variable: The categories of the article, 9 levels
|
| Day of Week |
Derived Variable: The time of the day from the (adjusted) posted column of the article categorical 7 levels
|
| Time Interval (Hour) |
Derived Variable: The time intervals of the articles derived from recursive splitting of the hour from the time of day column, to coincide with morning, afternoon, evening and night, categorical 4 levels
|
| Article Authors |
Crawled Variable: The author of the article. Authors who wrote fewer than 9 articles are collectively grouped into others. Categorical 20 levels
|
Data Transformation / Excluding Outliers
We perform the transformation on the variables to make them more suitable for regression analysis. We perform a square root transformation as well as a natural logarithm transformation on all response and explanatory variables whose distributions are not normal to reduce skewness and yield a more normal distribution.
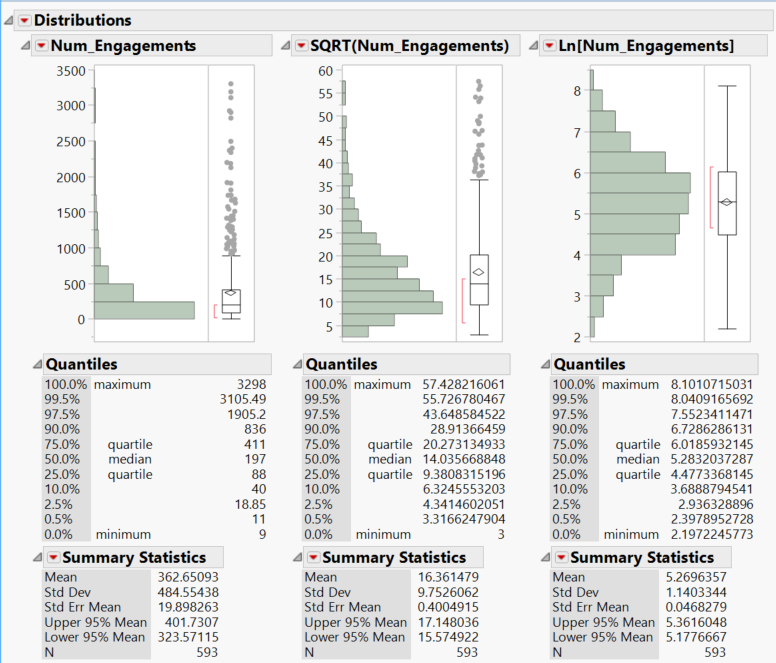 Transforming the Response Variables and removing the outliers
The outliers for the explanatory variables are judged by the independent variable distributions as well as the scatterplots of the response variable against the explanatory variables. We remove the following data points (as circled in the figure) as outliers.
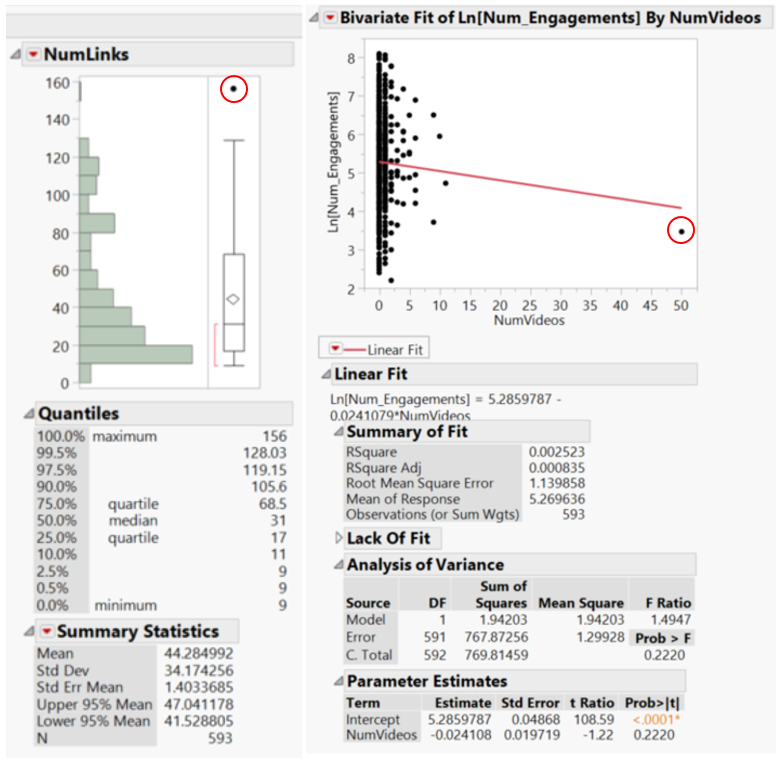 Transforming the Explanatory Variables and removing the outliers
Bivariate Fit
We also conduct bivariate analysis on the response variable against each transformed explanatory variable to review the linearity of fit. This step helps us to decide if the transformation of the variable is necessary, and we pick the transformation that provides the highest R2 value.
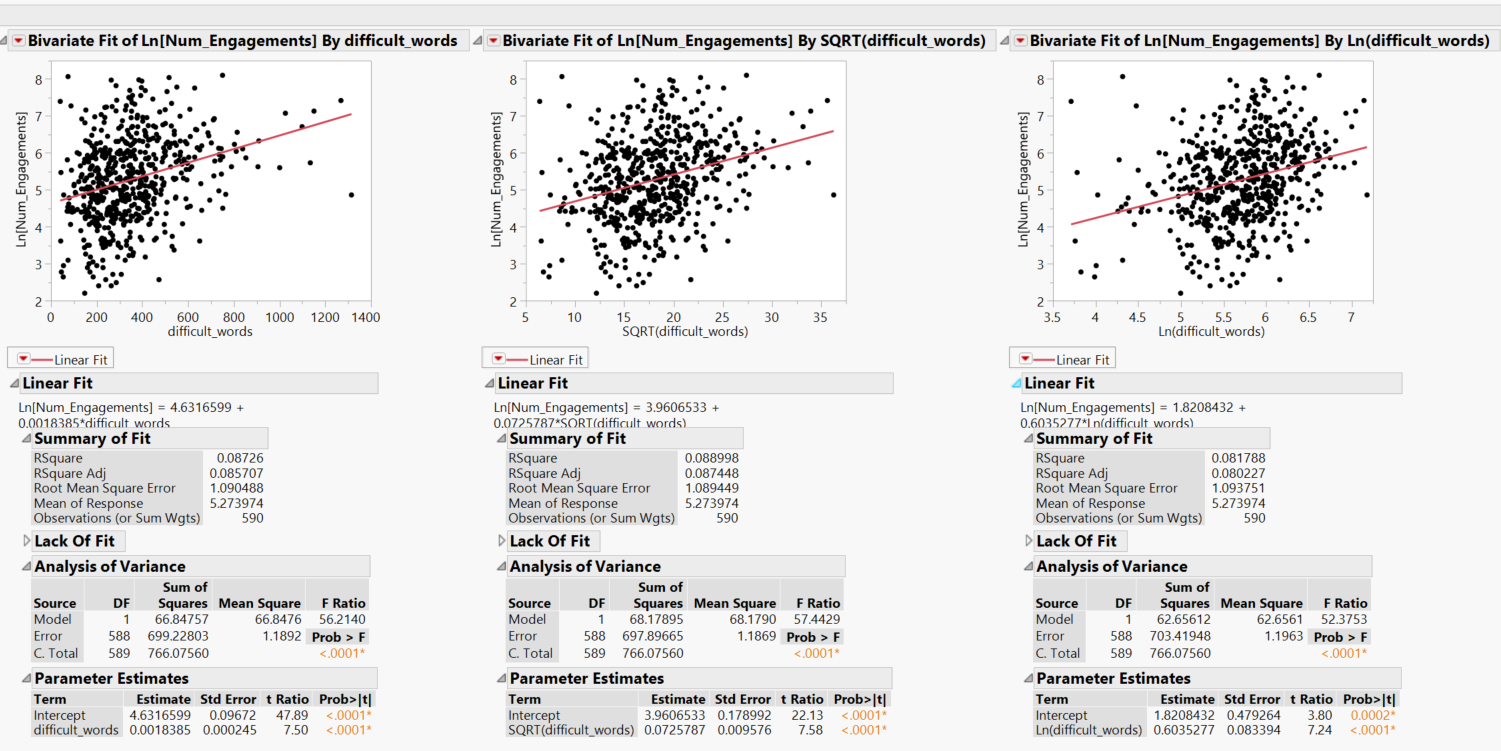 Bivariate fit of difficult words count. we select the SQRT transformation instead of the Ln transformation
This is repeated across all the explanatory variables, and we realise that all the readability indices have very poor R2 values (close to zero). We then examine further if the stepwise model will pick these measures even though individually the variables do not have strong explanatory power.
Checking for Multi-collinearity
We also ran bivariate fit against all the 18 numerical explanatory variables to test for multicollinearity. The figure below shows the bivariate correlation scatterplot.
 Bivariate correlation scatterplot matrix for all 18 numerical variables for the article model Using this scatterplot together with the bivariate correlation matrix, we eliminated 8 variables that are highly correlated. We ran Standard Least Squares regression on continuous numerical variables to verify the absence of multicollinearity in our remaining variables.
Final numerical explanatory variables estimate with VIF statistics
As a result, we have the narrowed down version of our final list of numerical continuous explanatory variables to explain the variation of our response variables for the article regression model in preparation for the next step which is the stepwise regression.
Stepwise Regression
We proceed with the creation of our explanatory model by running stepwise regression within the Fit Model platform on JMP Pro 13 on the variables filtered from the steps above with the inclusion of categorical variables (that will be dummy coded by JMP). We conduct a p-value threshold regression at 5% which gives the best R2 and adjusted R2 values, indicating the best model fit given the available data. We ran the regression for the forward, backward and mixed directions and realised that the R2 values for the three different directions are the same. We then select the mixed direction to run our model with. AICC and BICC measures are not used since we are looking at an explanatory model instead of a predictive model.
Article Regression equation for Ln(Total engagement)
Article Regression Parameter Estimates for Ln(Total engagement)
Evaluation of Model Fit
Model Assumptions
Interpretation and Managerial insights
|
|
|
|
|
|
|
| |
|
| |
|
| |
|
|


