Difference between revisions of "ANLY482 AY2017-18 T2 Group15 Data Analysis"
Jump to navigation
Jump to search
| Line 54: | Line 54: | ||
<br/> | <br/> | ||
::To create a dashboard for Company X on visualization software, the team had to clean and check the data for consistency. However, the data format used by the client is not suitable for dashboard creation due to the following: | ::To create a dashboard for Company X on visualization software, the team had to clean and check the data for consistency. However, the data format used by the client is not suitable for dashboard creation due to the following: | ||
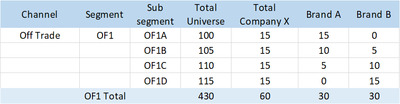
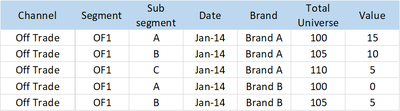
| − | ::#Not every column contains a field name, making visualisation difficult. | + | ::#Not every column contains a field name, making visualisation difficult. For example, if there is a column for each brand name, as shown in Figure 1, it is challenging to divide the data according to Brands, for analysis. Instead, the different brand names should be lists below a field, "Brand", as shown in Figure 2. |
| − | ::#Brand names were inconsistent across different files. | + | ::#Brand names were inconsistent across different files. For instance, "Overall Brand X" in one file could be named as "Brand X Total" in another. This causes inaccuracies when selecting brands in filters, as some brands may be unintentionally selected or unselected. |
| − | + | <br/> | |
| − | ::::::::::::::::Figure 1: Format of | + | ::::::::::::::::Figure 1: Format of Distribution data before cleaning |
[[File:Raw Distribution.png|center|400px|Figure 1: Format of sales data before cleaning]] | [[File:Raw Distribution.png|center|400px|Figure 1: Format of sales data before cleaning]] | ||
<br/> | <br/> | ||
| − | ::::::::::::::::Figure 2: Format of | + | ::::::::::::::::Figure 2: Format of Distribution data after cleaning |
| − | [[File: | + | [[File:Clean DIstribution.png|center|400px|Figure 2: Format of sales data after cleaning]] |
Revision as of 10:59, 11 April 2018
DATA PROVIDED
- The client provided the following datasets in Excel format:
- Monthly Distribution Data of their brands across their distribution channels, from 2014 to 2017.
- Quarterly data on public perception of their brands and competitor brands, based on specific Key Performance Indicators (KPIs), from 2014 to 2017.
- Monthly Sales Data of their brands from an external Market Research Company, from 2014 to 2017.
- A file containing the current dashboard the client uses, and intermediate data which has been processed from raw data.
DATA CLEANING
- To create a dashboard for Company X on visualization software, the team had to clean and check the data for consistency. However, the data format used by the client is not suitable for dashboard creation due to the following:
- Not every column contains a field name, making visualisation difficult. For example, if there is a column for each brand name, as shown in Figure 1, it is challenging to divide the data according to Brands, for analysis. Instead, the different brand names should be lists below a field, "Brand", as shown in Figure 2.
- Brand names were inconsistent across different files. For instance, "Overall Brand X" in one file could be named as "Brand X Total" in another. This causes inaccuracies when selecting brands in filters, as some brands may be unintentionally selected or unselected.
- To create a dashboard for Company X on visualization software, the team had to clean and check the data for consistency. However, the data format used by the client is not suitable for dashboard creation due to the following:
- Figure 1: Format of Distribution data before cleaning

- Figure 2: Format of Distribution data after cleaning
