ANLY482 AY2017-18 T2 Group15 Data Analysis
Jump to navigation
Jump to search
Figure 1: Format of Distribution data before cleaning
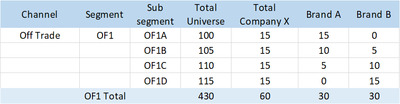
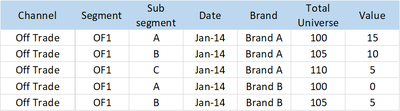
Figure 2: Format of Distribution data after cleaning
DATA PROVIDED
- The client provided the following datasets in Excel format:
- Monthly Distribution Data of their brands across their distribution channels, from 2014 to 2017.
- Quarterly data on public perception of their brands and competitor brands, based on specific Key Performance Indicators (KPIs), from 2014 to 2017.
- Monthly Sales Data of their brands from an external Market Research Company, from 2014 to 2017.
- A file containing the current dashboard the client uses, and intermediate data which has been processed from raw data.
DATA CLEANING
- To create a dashboard for Company X on visualization software, the team had to clean and check the data for consistency. However, the data format used by the client is not suitable for dashboard creation due to the following:
- Not every column contains a field name, making visualisation difficult. For example, if there is a column for each brand name, as shown in Figure 1, it is challenging to divide the data according to Brands, for analysis. Instead, the different brand names should be lists below a field, "Brand", as shown in Figure 2.
- Brand names were inconsistent across different files. For instance, "Overall Brand X" in one file could be named as "Brand X Total" in another. This causes inaccuracies when selecting brands in filters, as some brands may be unintentionally selected or unselected.
- To create a dashboard for Company X on visualization software, the team had to clean and check the data for consistency. However, the data format used by the client is not suitable for dashboard creation due to the following:
- For the purposes of this study, the team changed the format of the data files by transposing the data in Excel to that seen in Figure 2 below. The format shown in Figure 2 is known as the Flat Table data structure, which ensures that every column starts with a cell containing the field name that describes the column values. This allows the data to be recognized by the visualization platforms. In addition, the problem of brand name inconsistency has been addressed by standardising the brand names where possible, which will minimise inaccuracies.


DATA CLEANING TOOLS USED
 |
QUALITY CHECKING
|
RELATIONAL DATABASE
- For the academic purposes of this study, this section explaining our research on the Relational Data structure, which is a recommended industry practice for our client in future, has been included.
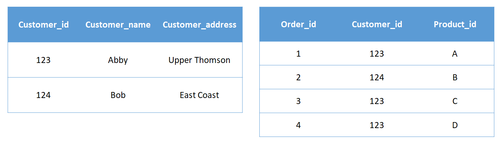
- A Flat Table data structure consists of a single table of data for a specific aspect of the business. There are no relationships within the data table or with other data sources. In contrast, a Relational database comprises of multiple tables that are related to each other through specific key fields.
- A Relational holds an advantage in its ability to reduce duplicate data. For example, in a single table labelled “Orders” in a Flat Table data structure, a new record is added whenever an order is made. With only one table, all the general information related to that order will have to be entered, including the general information of the customer placing the order. If the same customer places another order, the information has to be re-entered which is redundant.

- In contrast, a Relational database would have separate tables for “Orders” and “Customers”, with customer information in the “Orders” table to be linked to a unique customer ID. In this manner, changes made to customer information can be done in the “Customer” table without having to change any duplicates in the “Orders” table.

- The following lists some of the main advantages of a Relational database for our client:
- It provides the user with flexibility by allowing them to specifically filter the data to be displayed.
- Strong data typing and validity checks ensure that values are within acceptable ranges and required data are present. Referential integrity amongst tables prevents records from being incomplete, thus ensuring accuracy and consistency.
- The natural scalability of the database makes it highly adaptable to new business requirements as they arise.
- Its design ensures a base level of third normalization form, thus ensuring robustness and dependability.
- It will allow our client to improve data cleaning and structuring methodologies to align with best industry practices.
- Data is easily loaded onto most visualization platforms.
- In addition, when compared specifically to the Flat Table format, further advantages of the Relational database are as follows:
- There will be fewer duplicate data points, resulting in reduced computational and query time.
- There is less data repetition, which leads to minimized input errors and inconsistencies.
- Due to the above reasons, the data file sizes will be more compact and easily shareable.
- Despite being inferior to the Relational data structure, the Flat Table format is still widely used within this industry for storing data (in Excel or CSV files), especially when data volume is low. Using the Flat Table format was necessary in the context of this study as we were required to integrate data from several external sources in the dashboard requested by our client. The team encountered the limitation of having to connect to their existing data warehouse while adding on the necessary additional data fields. Furthermore, as the team was not allowed access to the data warehouse, they lacked the understanding and information to code out the necessary LOAD scripts. As such, the team had to adopt a Flat Table structure in our dashboard creation in this study.
- While Relational databases may be more challenging to design and maintain, they are more flexible and hold significant advantages over other databases in the long run. Based on our research on Relational databases, the team recommends that our client adopt the Relational data structure moving forward to maximize their benefits from the study.