ANLY482 AY2017-18 T2 Group15 Project Overview
Jump to navigation
Jump to search
OUR MOTIVATIONS
- Data visualization is an important tool in driving success in businesses. Because of the way our brains process information, certain methods of data presentation, such as clear charts and graphs, make it much easier to convey important information and concepts to an audience, as compared to spreadsheets and reports.
- This is especially important for large companies, which have access to large amounts of data, as their data may hold crucial information on the business and the market. By adopting standardised processes of data cleaning, structuring and transformation, businesses can create visualisations which improve business decisions and efficiency.
LITERATURE REVIEW
- The selection of a suitable business intelligence (BI) analytics tool that fits the enterprise is critical to the success of any BI project of an organization. We visualize data for various purposes and these direct us to select and design visualization in particular ways that rely on software tools which support particular features. To simplify the process of the selection, we may classify the requirements based on their degree of necessity. Furthermore, there are also special considerations with regards to obtaining those specific features in a tool – the requirement of custom coding, purchase of an add-on product from third party or a special product edition. For this comparative study, the team will be basing their evaluation on this list of criteria in Table 1. While this may not be an exhaustive list of requirements for a visualization tool, it satisfies three main conditions that many, if not all, organizations require in their BI tool – ease of use, data connectivity, line-of-business fit.
| Category | Requirement |
|---|---|
| 1. Visualizations | Useful charts and their features |
| 2. Interaction | Ways in which the information that you're viewing or the visualization that you're using to view it can be easily modified to see things differently |
| 3. Multi-chart Displays | Combining multiple charts on a single screen for simultaneous viewing |
| 4. Statistical Calculations | Built-in descriptive statistical functions |
| 5. Speed of Response | The time it takes for operations to complete once initiated |
| 6. Data Access and Integration | The ability to access data from all useful sources and to integrate data sets with ease |
| 7. Output and Content Management | Ways in which information can be delivered to others |
| 8. Platform Options | The devices on which the tool can be used |
| 9. Ease of Learning and Use | The ease with which analysts of various types can learn to use the product |
| 10. Programmability | The ability to easily and extensively customize and automate a particular set of analytical tasks for repeated use |
| 11. Advanced Features | Support for data mining, collaborations, audit trails, etc. |
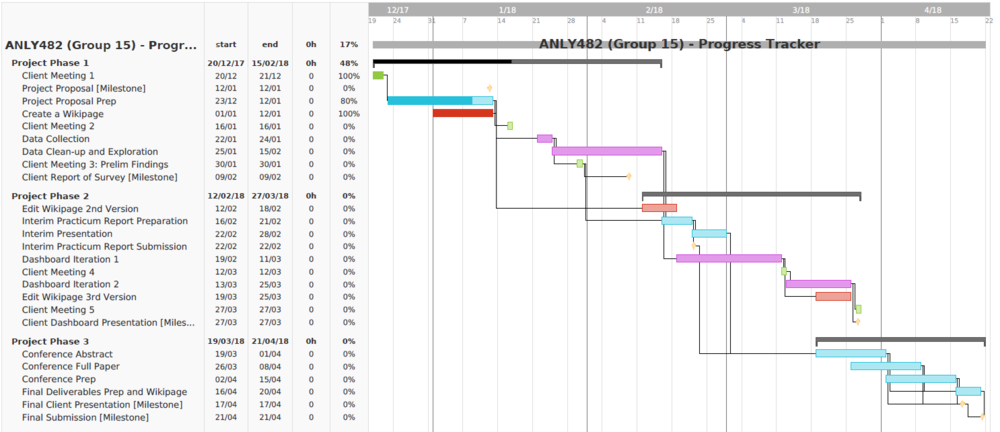
OUR WORK PLAN
