Difference between revisions of "ANLY482 AY2017-18 T2 Group15 Data Analysis"
Jump to navigation
Jump to search
(Undo revision 22975 by Amanda.lim.2014 (talk)) |
|||
| Line 31: | Line 31: | ||
{| style="background-color:white; color:white padding: 5px 0 0 0;" width="100%" height=50px cellspacing="0" cellpadding="0" valign="top" border="0" | | {| style="background-color:white; color:white padding: 5px 0 0 0;" width="100%" height=50px cellspacing="0" cellpadding="0" valign="top" border="0" | | ||
| − | | style="vertical-align:top;width:50%;" | <div style="padding: 1px; text-align:center; line-height: wrap_content; font-size:14px; border-top:3px solid #ffcc16;background:#545454;border-bottom:3px solid #ffcc16 "> [[ | + | | style="vertical-align:top;width:50%;" | <div style="padding: 1px; text-align:center; line-height: wrap_content; font-size:14px; border-top:3px solid #ffcc16;background:#545454;border-bottom:3px solid #ffcc16 "> [[ANLY482 AY2017-18 T2 Group15 Data Structures| <font color="#FFFFFF"><b>'''DATA STRUCTURES'''</b>]] |
| style="vertical-align:top;width:50%;" | <div style="padding: 1px; text-align:center; line-height: wrap_content; font-size:14px; border-top:3px solid #ffcc16;border-bottom:3px solid #ffcc16"> [[ANLY482 AY2017-18 T2 Group15 Data Visualization Platforms| <font color="#000000"><b>'''DATA VISUALISATION PLATFORMS'''</b>]] | | style="vertical-align:top;width:50%;" | <div style="padding: 1px; text-align:center; line-height: wrap_content; font-size:14px; border-top:3px solid #ffcc16;border-bottom:3px solid #ffcc16"> [[ANLY482 AY2017-18 T2 Group15 Data Visualization Platforms| <font color="#000000"><b>'''DATA VISUALISATION PLATFORMS'''</b>]] | ||
Revision as of 10:08, 11 April 2018
DATA CLEANING
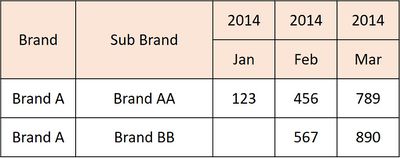
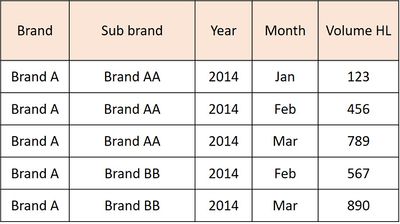
- To create a dashboard for Company X on Tableau and Qlik Sense, the team had to clean and check the data for consistency. Initially, the data was not in relational format and there were null and negative values. For example, the sales data was given to us in the format as shown in Figure 1. Since the data needs to be in relational format for Tableau and Qlik Sense to generate dashboards, we changed the format by transposing the data in excel. The format of the sales data was thus changed, as seen in Figure 2.
- Figure 1: Format of sales data before cleaning

- Figure 2: Format of sales data after cleaning
