Analysis of User and Merchant Dropoff for Sugar App Time Series
| Mid-Term | Finals |
|---|
| Funnel Plot Analysis | Time Series Analysis | Geospatial Analysis |
|---|
Contents
Abstract
A two-sided market is defined as a platform enabling two groups of end-users to interact with each other while the platforms charges for transactions made between the groups. In such a market, each additional User should attract more Merchants and vice versa, a.k.a. the network effect. While many papers on two-sided markets exist, little of them test for network effects for ecommerce. This paper tests the presence of network effects and solves the chicken-or-egg problem by examining the relationship of Users, Merchants and Revenue. This is done by a unique dataset provided by a location-based deals mobile app.
Aggregating transactional data into 97 rows of weekly number of Users, Merchants and Revenue, we constructed three multiple linear regression models on time series data to test the hypotheses. Results show that network effects are not present. Additional Merchants are associated with increased Users. However, additional Users are not associated with additional Merchants. Solving the chicken-or-egg problem, results show that additional Users, not Merchants, are associated with more Revenue. From this, we derived two recommendations for the app. Firstly, they can allocate more resources on user acquisition than merchant acquisition. Secondly, the app should attempt to increase its network effect via reducing information asymmetry. On top of that, we created a prediction model that is able to predict the end-of-month revenue with a R-squared value of 0.87 given user data.
| Introduction |
A two-sided market or two-sided network is generally defined as a platform enabling two groups of end-users to come “on board” by charging one or both sides (Rochet & Tirole, 2004). Examples include Alibaba, eBay, Groupon, Uber, Visa and many more e-commerce companies, where they have two main sides: Users and Merchants. These platforms connect users and merchants and earn a premium for connecting these two groups by charging the transactions made between the two groups.
The power of a two-sided market is its network externalities. If successful, it will create positive cross-side externalities, i.e. a virtuous cycle, where the demand of one user group spurs from the other (Eisenmann, Parker & Van Alstyne, 2006) (See Figure 1). Such network effects create some of the fastest growing companies in the world by reducing search costs (Hagiu, 2014). However, late entrants often are put into a critical disadvantage due to the size of the incumbent and the network efforts. Furthermore, all platforms face a chicken-or-egg problem, whether to attract users or merchants first, and it is one of the most difficult to solve (Hagiu, 2014). As such, in a two-sided market, there are three hypotheses that needs to be true if network effects are true:
- Merchant Growth(IV) is associated with User Growth(DV)
- User Growth(IV) is associated with Merchant Growth(DV)
- Revenue Growth(DV) is a function of User(IV) and Merchant Growth(IV)
Therefore, there are two goals of this paper. Firstly, this paper tests the presence of network effects using time series data provided by a location-based ecommerce mobile app. Network effect would be confirmed if both hypotheses 1 and 2 were true. Secondly, this paper seeks to crack the chicken-or-egg problem by determining which side, Users or Merchants, adds more value. To do so, this paper will construct 3 multiple linear regressions models to test the hypotheses above.
This paper consists of six sections. It starts with the Literature Review section that will describe the definition of a two-sided market and the research surrounding two-sided market. It will show that little research has been done to empirically test network effects for ecommerce apps. Following that, the Method section will talk about the data preparation steps and the methodology of constructing 3 multiple linear regression models with trend variables, lag variables and 2 independent variables. Then, the Results section will present the findings and conclusions of each hypotheses testing. Fourthly, the paper will discuss the findings in the Discussion section with the finding’s implications and recommendations. Fifthly, a prediction model is constructed for the app to forecast the end-of-month revenue. Finally the paper will end with conclusions and suggestions for further research.
Literature Review
Two-Sided markets
The definition of a two-sided market is broadly about getting two sides “on board”, but such a definition may not be restrictive enough (Rochet & Tirole, 2004). Current definition of multi-sided platforms may be too inclusive or broad (Hagiu & Wright, 2015). However, 2 key features are present in multi-sided platforms and not in other businesses: (1) enabling direct intercommunication between two or more sides, (2) each side has a relationship with the platform (Hagiu & Wright, 2015). Rochet & Tirole(2004) defined it as a two-sided market if the platform can change the volume of transactions by charging one side of the market and subsidizing the price paid by the other side by an equal amount.
For networks effects, it can be positive or negative, cross-sided or same sided or cross side. Same-sided network effects refer to effects that affect the group it originates from, for example, an additional fax machine makes the whole network more valuable for everyone who owns a fax machine. Cross-sided network effects are when one side of a multi-sided market affects the other side and it can be either positive or negative. An example of negative cross-sided network effects can be found in the media industry, where the advertisers will exert a negative effect on the number of users because they are averse to additional advertisements (Reisinger, 2004). A positive cross-sided network effect is one where one group fuel demands of the other in a positive manner, creating a virtuous cycle (Eisenmann, Parker & Van Alstyne, 2006).
Various papers have demonstrated network effects in two-sided markets. However, current papers on two-sided markets usually explore pricing choices whereas papers on network effects usually look into adoption by users and network size (Rysman, 2009). Furthermore, Rysman (2009) found that papers on two-sided markets focused more on media, payment systems, and matching markets while the papers on network effect look into technology and telecommunications market. Kim, Lee & Park(2012) tested the existence of cross-sided network effects using a novel approach by examining the advantage of the incumbent(Groupon) over the new entrant(Living Social). Rysman (2007) found the existence of a positive feedback loop between consumer and merchant using data on payment card, suggesting cross-sided network effects. However, from our research, few or no papers test network effects for ecommerce mobile apps. Furthermore, papers testing network effects on online platforms usually do not have direct data on User and Merchants. Lastly, few papers have used a time-regression model to examine network effects.
As such, this paper will utilize a unique ecommerce data set to test the existence of cross-sided network effects with empirical User and Merchant data using a time-regression model approach.
Methodology
The ecommerce data set is provided by a location-based ecommerce mobile app. The mobile app offers local deals tailored to the user’s location. It helps local small businesses such as cafes, restaurants, and small retail shops get discovered and market deals to users close in proximity. Whenever the user opens the app, they can see a list of discounted items from merchants nearby. By definition, the app exists as a platform in a two-sided market. As users do not interact with other users in the app and the same applies for merchant, same-sided network effects does not apply. Using its data on user growth and merchant growth, we can test the presence of network effects and as such, it has the valid data to test our hypotheses for cross-sided network effects.
| Data |
The app company provided the dataset. It consists of transactional data from Feb 2014 to Jan 2016 and has 3 tables:
- Users table – over 46,000 rows of users id and their join date
- Merchant Table – over 1440 rows of merchants and their join date
- Order Table – over 54,000 rows of orders and the margin of each order
| Data Preparation |
The first stage of data preparation involves preparing the data set only for Singapore. First, the Users table was cleaned to only contain Singapore users. Secondly, Merchants table was cleaned to only contain Singapore Businesses, and to eliminate duplicates. Thirdly, the Users table and Merchants table was inner joined with the Order table to eliminate all non-Singaporean users and businesses. We further cleaned the data using order’s latitude and longitude to eliminate all orders made outside Singapore.
The second stage involves cleaning out invalid orders and outliers. Using the order status, invalid orders were cleaned out. These orders are either cancelled, unpaid, or refunded and hence do not represent part of revenue. There were other orders that was part of the app’s promotional giveaway and were cleaned out as well.
Finally, data was aggregated into weeks and three times series were formed:
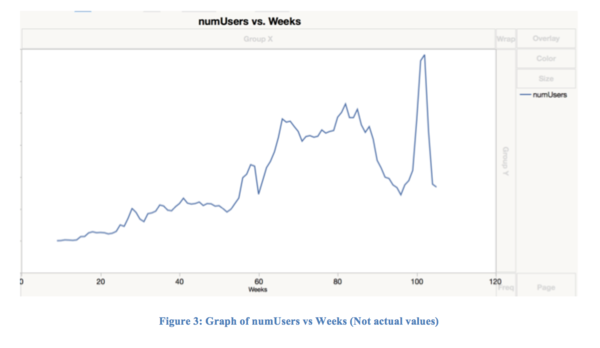
- numUsers: The number of new users for that week
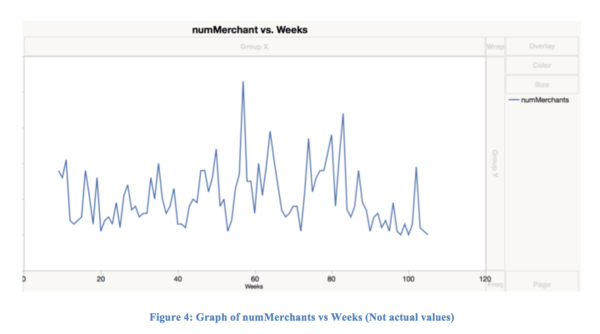
- numMerchants: The number of new merchants for that week
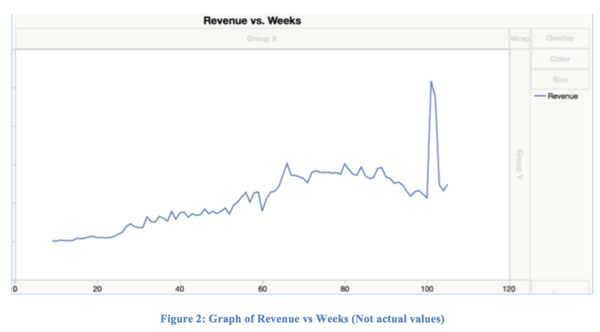
- Revenue: The revenue for that week.
After the data preparation step, the aggregated dataset consist of 97 rows of numUsers, numMerchants and Revenue. The data for the first week of Jan 2016 was excluded due to incomplete data.
| Tools Used |
SAS JMP Pro 12 will be used to perform the time series analysis. SAS JMP Pro 12 is an analytical software that is able to handle large volumes of data efficiently, which is imperative since the app’s data is too large to be handled by other software such as Microsoft Excel.
| Constructing the Population Regression Model |
Each hypothesis is tested with a multiple linear regression model. Instead of singular linear regression, instead, multiple linear regression is used to avoid the omitted variable bias, which results in the coefficient estimates being wrong on average when a related variable in not included.
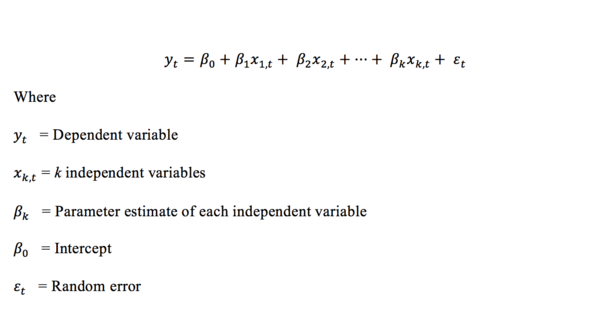
With time series data, the definition of the population regression model to estimate is:
Depending on the hypothesis, the dependent variable yt and k independent variables x(k,t) will be different. Using the parameter estimates, this model will give us an indication, which variables can significantly explain the dependent variable and which are more important. However, observing the graph, a trend also seems to be present for Revenue and Users but not Merchants.
To detect Trend, an extra variable (β(k+1) t) is used. This variable increases incrementally (9,10,11,12…k+1). As such it results in the following regression model:
The trend variable is important to include so as to avoid the third variable problem otherwise, it is difficult to sieve out the true effects of the independent variables.
Furthermore, it is also possible that it takes time for the independent variable to have an effect on the dependent variable. Therefore, it is important to detect if lagging a variable would improve the fit of the model. An arbitrarily lag of eight, an equivalent of two months, was chosen as it was deemed sufficient to detect the effects if it was present. To detect the effects of lag, extra independent variables will be constructed, and each of the variables will be lagged from 1 to 8 periods- i.e. (t-1) to (t-8).
Method for Hypothesis 1
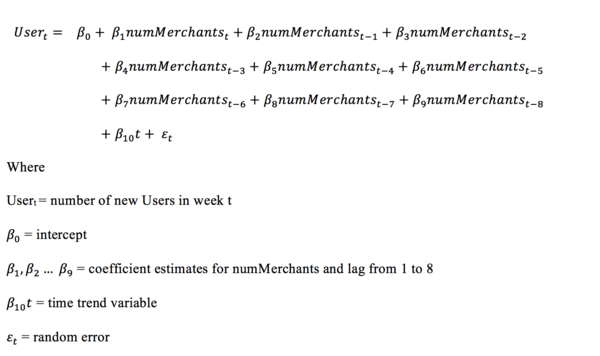
After constructing the lag and time variables, to test hypothesis 1, whether Usert is a function of Merchants, we estimate the population regression model of users to be:
Method for Hypothesis 2
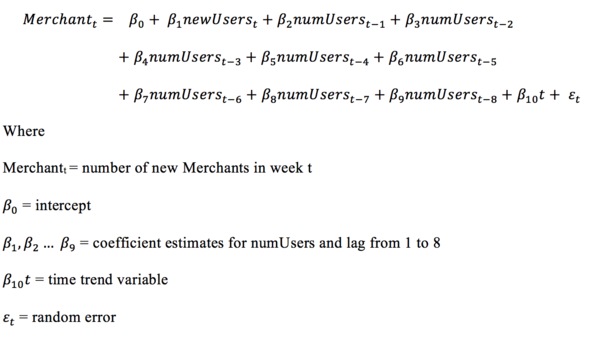
To test hypothesis 2, we would also need to test the effects of users on merchants. As such, we estimate the population regression model for Merchantt to be:
Method for Hypothesis 3
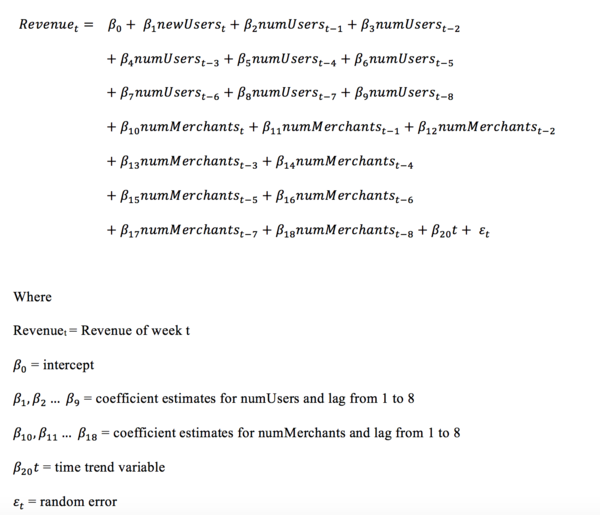
To test hypothesis 2 & 3, we estimate the population regression model of Revenuet to be:
Results
| Hypothesis 1: Merchant Growth(IV) is associated with User growth(DV) |
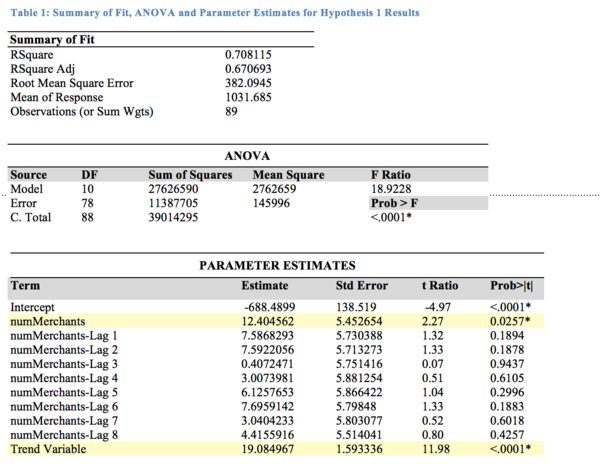
To test this hypothesis, we constructed a model to estimate Usert. The results of the user model are shown below:
The User model is moderately a good fit with an R-squared value of 0.708. F-test for the whole model shows that at least one independent variable explains a significant portion of the observed variation of numUsers at α=0.05. T-test for each independent variable shows that only numMerchants and Trend variable are significant at α=0.05 to explain the variation in numUsers. This shows that an upward trend is detected and lagging the variables does not produce a significant result. Looking at the parameter estimates, holding all other coefficients constant, it is estimated that each additional merchant in a week is associated with an increase of around 12 users. The trend variable also tells us that each week is associated with a baseline increase of around 19 users.
Therefore, results support Hypothesis 1 that numMerchants affects Usert.
| Hypothesis 2: User Growth(IV) is associated with Merchant growth(DV) |
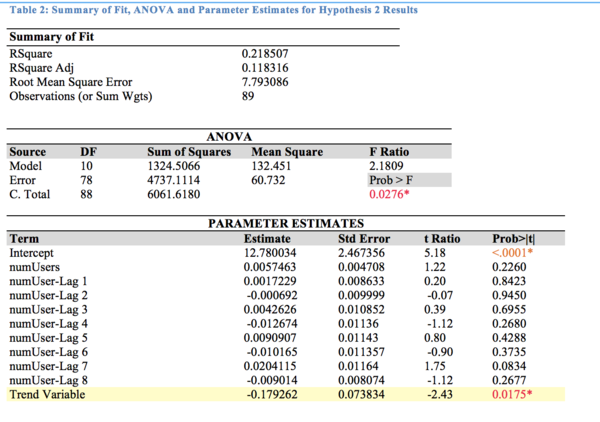
Using User variables as a function of Merchantt, we obtain the following results:
The Merchant model is not a good fit with an R-squared value of 0.226. F-test of F ratio 2.31 shows that at least one independent variable explains a significant portion of the observed variation of numUsers at α=0.05. T-test for each independent variable shows that only Trend variable is significant at α=0.05 to explain the variation in Merchantt. This shows that a slight downward trend is detected and tells us that each week is associated with a slight decrease of around -0.17 merchants. None of the numUser variables have p-value < 0.05, and hence we cannot say that numUsers can explain the variation in Merchantt.
As shown, numUser variables do not have a significant relationship with Merchantt and Hypothesis 2 is not supported.
| Hypothesis 3: Revenue Growth is a function of User and Merchant Growth |
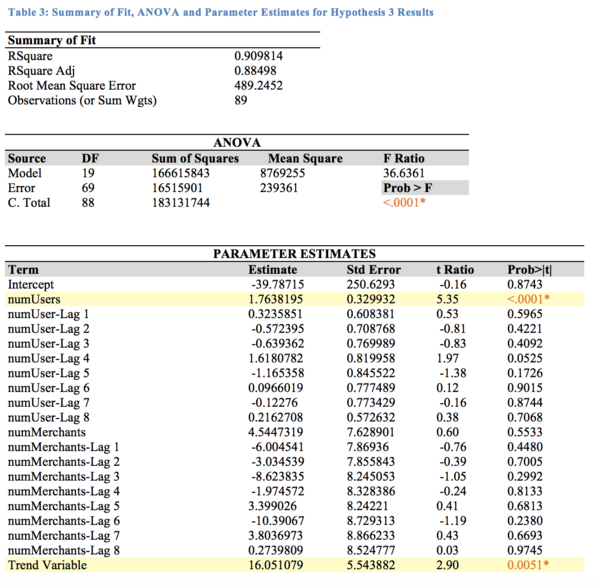
To test hypothesis 3, a revenue model is constructed to estimate Revenue at time t. The results are shown below.
The Revenue model is a good fit with an R-squared value of 0.91. F-test of F ratio 36.64 shows that at least one independent variable explains a significant portion of the observed variation of Revenuet at α=0.05. T-test for each independent variable shows that only numUsers and Trend variable are significant at α=0.05 to explain the variation in Revenuet. None of the Merchant variables and User Lag variables have p-values < 0.05, and hence we cannot say that these variables can explain the variation of Revenuet.
The parameter estimate tells us that, holding the other coefficients constant, each additional user is associated with an additional 1.76 dollars in revenue. The trend variable also suggests that each week is associated with an additional 16.05 dollars in revenue.
As shown, only the numUser variable, not the numMerchant variable, has a significant relationship with Revenuet and Hypothesis 3 is partially supported.
Discussion
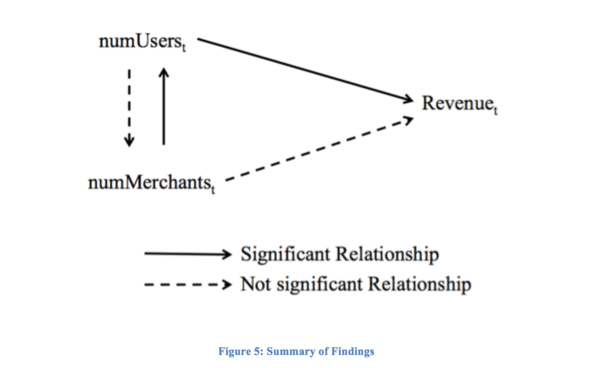
A summary of the findings is as shown in the diagram below.
As shown by the User model, numMerchant is a significant variable of Usert and this supports hypothesis 1. However, numUser is not a significant variable of Merchantt and does not support hypothesis 2. Finally, only numUser is a significant variable of Revenuet and hypothesis 3 is partially supported.
Firstly, hypothesis 1 is supported but not hypothesis 2. This does not lend support that network effects are present. Furthermore, the results seem to suggest a one-way relationship between User and Merchant. Each additional Merchant in a week is significantly associated with an increase of around 12 users but each additional User is not significantly associated with an increase in Merchants. This rules out the third variable problem, where marketing increase both Users and Merchants at the same time. If the third variable problem is true, Users will have a significant association with Merchants as well. Therefore, a strong inference can be made about the direction of the relationship that the increase of Merchants impacts the increase in Users and not the other way around.
Secondly, we observe that, when putting Users and Merchants into the same model, we observe that only Users have a significant relationship with Revenue. Additional Merchants or lagged variables of Merchant do not have a significant relationship with Revenue. This is a little surprising, as we would reasonably expect that users might be enticed with the new offers that each merchant can bring. However, it may suggest an indirect relationship between Merchants and Revenue. As shown above, Merchants may increase users, which in turn, may increase Revenue.
Thirdly, we observe that, in all case, lagging the variables does not produce a significant result. This implies there are little or no seasonality or cyclical patterns within the time series. This also suggests that any effect can be observed within a week.
Lastly, the Trend variable is significant in all models. This suggests that, the total amount of Users, Merchant and Revenue are increasing at an increasing rate. This would also imply the presence of recurring income. If each user merely buys once and never buy again, the trend variable for Revenue will not be significant.
| Implications |
The results imply two things. Firstly, the results imply that there are obstacles to network effect. One possible obstacle is information asymmetry. For network effect to occur, both groups must be visible - each group must be able to see that the other side is increasing. However, in the app’s case, merchants do not know how many users are in their vicinity and are not enticed to join. Hence, this may prevent network effect from forming. Secondly, the results imply that increasing users would be the most direct way to increase revenue, holding the other coefficients constant. The coefficient estimate also suggests that each additional User is worth around $1.76 to the company’s revenue in the first week.
| Recommendations |
Based on the implications, we have two recommendations that the app can consider:
1. Focus on User Acquisition First, Merchant Acquisition Second We recommend that the app focus on User growth instead of Merchant growth to maximize revenue. This answers the classic chicken-or-egg question that platforms struggle with, and it gives the app a clear direction for marketing.
2. Reduce Informational Asymmetry to attract more users and merchants We recommend that the app reduce the informational asymmetry issue, as they need the network effect to thrive as a multi-sided platform. On the merchant side, the app can show the number of users in the vicinity, which will attract them. For example, in the proposal to attract merchants, the app can highlight the number of users that frequent the area and the potential revenue that can be generated.
Prediction Model
Typically, there are lags in revenue reporting because of several reasons. Credit card payments usually are held for a number of days to avoid credit card fraud. Furthermore, there may also be order cancellations. As such, typically, there may not be an accurate picture of revenue until all the transactions are confirmed, which may sometimes stretch across months.
Therefore, on top of the explanatory model, we would like to use a predictive model to close the gap. If the predicted results are accurate, the company can use the forecast to plan for next month’s budget.
Univariate Prediction Model
To construct the predictive model, the last month (5 rows) of data was removed to form the training data. Initially, a univariate forecasting model was applied to forecast revenue. Several forecasting models were used. However, even the best model using the Winter’s method did not produce good results as shown below.
Multivariate Prediction Model
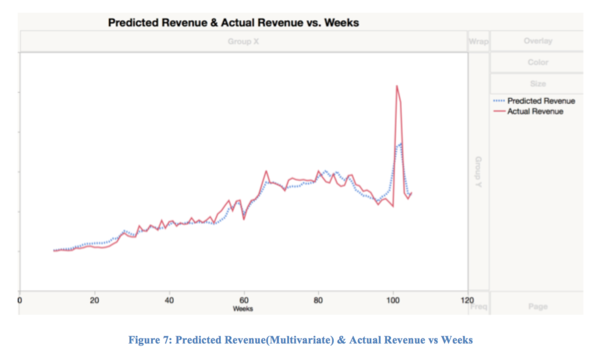
As shown, forecasting only using revenue is not able to catch the spike in the last month of the data. To do so, we need additional variables. Therefore, as we have found numUsers and Trend Variable to be significantly related to Revenue, we created a training model with User as one of the variable. After training the data, we arrive at the following linear regression model:
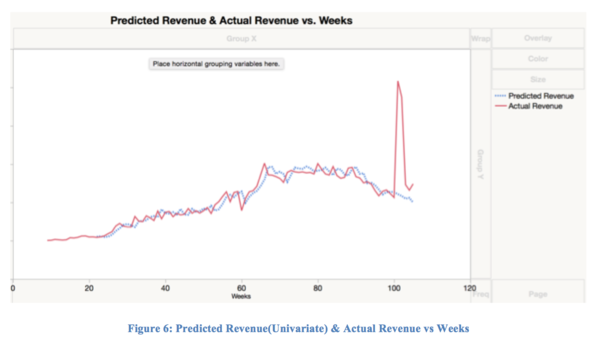
Then, we used the equation to predict the last month’s revenue with the last month’s user. The graph below shows the predicted revenue and actual revenue plotted on the same graph.
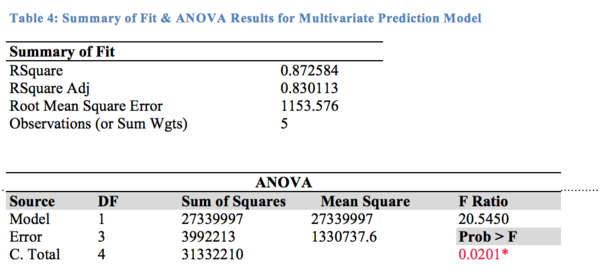
As shown in graph, the prediction model that incorporates the numUser and Trend variable is able to account for spikes. The table below shows the fit between the predicted revenue in the month of Dec 2015 versus the actual revenue in Dec 2015.
As the Bivariate analysis show, the fit between the predicted revenue and the actual revenue is good with a R-squared value of 0.87. The ANOVA test is significant, suggesting that the predicted revenue is significantly associated with the real revenue. As the results show, this predictive model can predict the last month’s revenue with an accuracy of 0.87 and can be used to forecast end of month revenue that may not be available until later due to delays.
Conclusion
In conclusion, our paper seeks to help the app, a platform in a two-sided market, to thrive by testing the presence of network effects and solve the chicken-or-egg problem. Three multiple linear regression models were constructed to test for three hypotheses. Results show that only Merchants impact Users but not the other way around, and thus no evidence of network effects was detected. To solve the chicken-or-egg problem, a third multiple linear regression model was used. It shows that User to be a significant driver of Revenue. Therefore, we recommend the app to focus on User acquisition and increase network effects via reducing information asymmetry. On top of that, we created a multivariate prediction model that is able to predict the end-of-month revenue with a R-square of 0.87.
As that this paper has established the relationships between User, Merchant and Revenue, future research can look into the different categories of merchants and users. Future research can involve clustering Users and Merchants into different types and multiple linear regression models can be used to determine which type merchants or users are more impactful to the company’s bottom line.
Disclaimer: All numbers used are masked to protect the business secrets of the app. Even though the analysis is still valid, the numbers do not reflect the actual revenue, user or merchant values.
References
Eisenmann, T., Parker, G., & Van Alstyne, M. W. (2006). Strategies for two-sided markets. Harvard business review, 84(10), 92.
Hagiu, A., & Wright, J. (2015). Multi-sided platforms. International Journal of Industrial Organization, 43, 162-174.
Hagiu, A. (2014). Strategic decisions for multisided platforms. MIT Sloan Management Review, 55(2), 71.
Hebert, D., Anderson, B., Olinsky, A., & Hardin, J. M. (2014). Time Series Data Mining: A Retail Application. International Journal of Business Analytics (IJBAN), 1(4), 51-68.
Kim, B., & Park, H. (2012). Two-Sided Platform Competition in the Online Daily Deals Promotion Market. IDEAS Working Paper Series from RePEc, IDEAS Working Paper Series from RePEc, 2012.
Reisinger, M. (2004). Two-sided markets with negative externalities. St. Louis: Federal Reserve Bank of St Louis. Retrieved from http://libproxy.smu.edu.sg/login?url=http://search.proquest.com/docview/1698670560?accountid=28662
Rochet, J. C., & Tirole, J. (2004). Two-sided markets: an overview (Vol. 258). IDEI working paper.
Rochet, J. C., & Tirole, J. (2006). Two sided markets: a progress report. The RAND journal of economics, 37(3), 645-667.
Rysman, M. (2009). The Economics of Two-Sided Markets. Journal of Economic Perspectives, 23(3), 125-143.
Rysman, M. (2007). AN EMPIRICAL ANALYSIS OF PAYMENT CARD USAGE *. Journal of Industrial Economics, 55(1), 1-36.
Schubert, S., & Lee, T. (2011). Time Series Data Mining with SAS® Enterprise Miner™ (1st ed.). SAS. Retrieved from https://support.sas.com/resources/papers/proceedings11/160-2011.pdf

