Analysis of User and Merchant Dropoff for Sugar App Geospatial
| Mid-Term | Finals |
|---|
| Funnel Plot Analysis | Time Series Analysis | Geospatial Analysis |
|---|
Contents
Abstract
The ability to accurately evaluate and improve the sales performance of its merchants plays an important role in the success of a deals discovery mobile application business. Unfortunately, most merchants undergo cannibalisation, where the introduction of a store decreases the sales of another store, which will complicate such analysis. However, there are little to no studies to measure or detect cannibalization, validated using real world data from a geospatial approach of analysis. In order to address these limitations, a practice research study has been conducted to explore the use of geospatial techniques to analyse and visualise this cannibalisation.
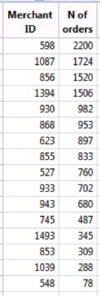
Using a location-based mobile deals application (app) in Singapore as a case study, this paper aims to share with you our journey through this research process and the insights gained. The case study’s dataset will consist of transactions from 2014 to 2015, where we focus on the geolocation aspect of the data, namely the locations where orders are made, and the locations where the orders are eventually redeemed. We shortlisted a sample of 7 merchants, comprising of a total 9117 rows of orders and 48 branches where the orders are redeemed. We used an open source software, QGIS, to analyse these merchants using the cannibalisation detection methodology we developed. The QGIS software is used to calculate and visualise the distance between each order’s start location and the branch where it is and should be redeemed. This allows observations as to whether each user is going to the nearest branch or going to another branch.
Our results show cases of active cannibalisation between branches, leading to a loss in potential sales. This methodology can be used by our client for its merchants to advise them as to which branch may be cannibalising or being cannibalised by other branches. Possible strategies for cannibalised branches are discussed to help get a more even distribution between branches.
| Introduction and Objectives |
Cannibalisation is defined as the undesired situation in which sales for one product sold by a company results in decrease in sales for another product by the same company (Capstone, 2003). From the perspective of a multi-store merchant, cannibalisation may occur when the addition of a new branch will result in decrease in sales for another branch by the same merchant (Dibb & Simkin, 1994). This is in part due to retail market share. A merchant’s share in a market is a function of the merchant’s presence in the market, determined by the floorspace of the merchant, and the number and strength of other competitive merchants (Mahajan et al, 1988). In order to establish presence and increase retail market share, merchants have the option to add more outlets. However, with an increasing amount of stores, the market in the area may be overly saturated, resulting in a loss of sales per number of stores due to a shift of consumer patronage to new branches from established branches (Ghosh & Craig, 1991).
The purpose of this paper is twofold. Firstly, to develop a methodology to detect instances of cannibalisation within branches using geospatial methods of analysis and open source software. This is to ensure easier replication by merchants who may want to utilize the methodology. Secondly, to conduct cannibalisation analysis using data from a location-based mobile deals application (app) in Singapore. This analysis will validate the effectiveness of the methodology in detecting and narrowing down cannibalisation between branches, as well as pinpoint the exact branches that overlap and cause potential loss in sales in order for merchants to make actionable decisions.
Literature Review
Retail location is considered to be one of the most important elements in retail marketing strategy, because of its immense advantages at the cost of long-term capital commitment. A good locations can lead to strong competitive advantages, simply because location is one of factor that cannot be easily imitated by competitors, raising barriers to entry (Öner, 2014).
As such, analysis of trade areas and its impact on a company’s revenue is deemed to be extremely important. However, these analysis was usually carried out by gut feeling, before the introduction of spatial modelling in the 80s and 90s. However, the development of these location allocation-based retail siting models aims to determine the network pattern that maximises system-wide goals, such as total profit or market share, without consideration of the addition of new branches affect the performance of existing branches (Achabal, Gorr & Mahajan, 1982; Ghosh & McLafferty, 1982; Ghosh & McLafferty, 1987).
Most studies examine trade area analysis in terms of competition, but few studies have examined it in terms of cannibalisation. Cannibalisation is defined as the undesired situation in which sales for one product sold by a company results in decrease in sales for another product by the same company (Capstone, 2003). From the perspective of a multi-store merchant, cannibalisation may occur when the addition of a new branch will result in decrease in sales for another branch by the same merchant (Dibb & Simkin, 1994). Studies to analyse such instances of cannibalisation used geospatial methods of analysis, however they lack actual data to validate their analysis (Dibb & Simkin, 1994; O’Kelly, 2001; Clarke, 2006). As such, this paper will develop a methodology used to detect cannibalisation, and utilize a location-based mobile deals application data set to validate these effects using a geospatial approach.
Methodology
| Tools Used |
For our analysis, the QGIS software was chosen as it is open source, with a large amount of documentation and plugins available in the market. It is also the preferred software of choice for the Geospatial class in our university, which allowed us to access to more resources, namely the teaching materials, as well as the experience of our fellow university peers. This allowed us to construct a detailed methodology that is easy and detailed enough for our client to replicate.
The two main functions that QGIS is primarily used for in this paper is to: 1) calculate the distance to current branch, 2) identify the nearest possible branch (which may not be the current branch) and calculate the corresponding distance. These data can then be visualised using a graphical interface. The QGIS software can be obtained from the following link: http://www.qgis.org/en/site/forusers/download.html
| Client |
The data set this paper uses for analysis is provided by a location-based ecommerce mobile app. The mobile app offers local deals tailored to the user’s location. It helps local small businesses such as cafes, restaurants, and small retail shops get discovered and market deals to users close in proximity. Whenever the user opens the app, they can see a list of discounted items from merchants nearby. Due to the multiple branches of each merchant, there is a chance for cannibalisation to occur within the branches of a merchant. As the app provides location based services, this gives us the opportunity to analyse the location of the consumer upon purchase, as well as the location as to which the consumer redeems the purchase. With this information, we can develop a methodology to detect acts of cannibalisation using geospatial methods of analysis. We can also proceed to validate this methodology using the dataset provided.
| Flow Diagram |
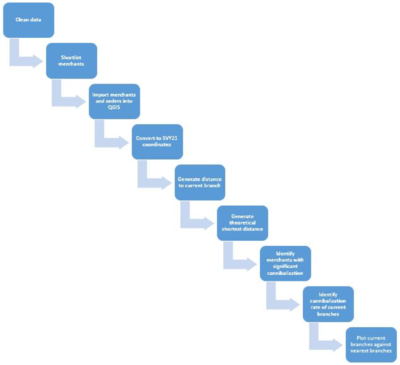
To ensure the replicability of the cannibalisation model, the steps taken to reproduce it are captured in a flow diagram which users need only follow.
The steps are as follows:
- Clean data
- Remove all non-organic orders
- Constrain orders to within the geographical region of interest
- Shortlist merchants
- Due to computational complexity, shortlist merchants that are significant
- Import merchants and orders into QGIS
- Convert to SVY21 coordinates
- This is a Singapore specific coordinate systems that allow for accurate calculation of distance for the geographical region of Singapore
- If geographical region lies in non-Singapore region, user will have to find a corresponding coordinate system, or rely on the great circle equation
- Generate distance to current branch
- Done using Hub Lines of the MMQGIS plugin
- Generate theoretical shortest distance
- Done using Hub Distance of the MMQGIS plugin
- Identify merchants with significant cannibalisation
- Done by plotting merchants against the percentage of orders of the merchant that have the current branch being the nearest branch
- Identify cannibalisation rate of current branches
- Done by plotting current branches against the percentage of orders that have the current branch being the nearest branch
- Plot current branches against nearest branches
- This is to observe the specifics of cannibalisation, namely which branches cannibalise which others
By using this model, merchants can then analyse the cannibalisation rate of their branches. By doing so, merchants can then work with their branches to minimize the cannibalisation rate and improve revenue stream.
| Data |
The app company provided the dataset. It consists of transactional data from Feb 2014 to Jan 2016 and has 3 tables:
- Users table – over 46,000 rows of users id and their join date
- Merchant Table – over 1440 rows of merchants and their join date
- Order Table – over 54,000 rows of orders and the margin of each order
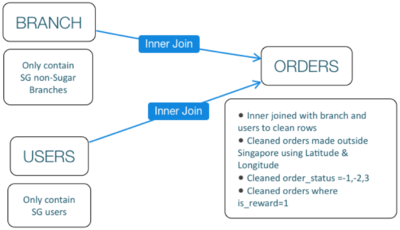
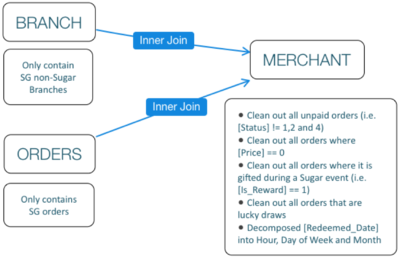
The first stage of data preparation involves preparing the data set only for Singapore. First, the Users table was cleaned to only contain Singapore users. Secondly, Merchants table was cleaned to only contain Singapore Businesses, and to eliminate duplicates. Thirdly, the Users table and Merchants table was inner joined with the Order table to eliminate all non-Singaporean users and businesses. We further cleaned the data using order’s latitude and longitude to eliminate all orders made outside Singapore.
The second stage involves cleaning out invalid orders and outliers. Using the order status, invalid orders were cleaned out. These orders are either cancelled, unpaid, or refunded and hence do not represent part of revenue. There were other orders that was part of the app’s promotional giveaway and were cleaned out as well.
The details for the initial data preparation can be found at the following link: https://wiki.smu.edu.sg/ANLY482/Analysis_of_User_and_Merchant_Dropoff_for_Sugar_App_Data_Source
| Shortlist Merchants |
After this initial data preparation, two verticals from the cleaned dataset are highlighted to be focused on: Orders and Merchants. Orders are what users have purchased and have the following fields which will be of interest:
- Order ID
- Branch ID (e.g. Store X )
- Brand ID (e.g. Nike)
- Latitude
- Longitude
Merchants have the following fields:
- Branch ID (e.g. Store X)
- Brand ID (e.g. Nike)
- Latitude
- Longitude
However, assuming (for each merchant) there are n number orders and m number of possible branches per order, analysis will face a run time of potentially nm per merchant.
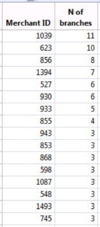
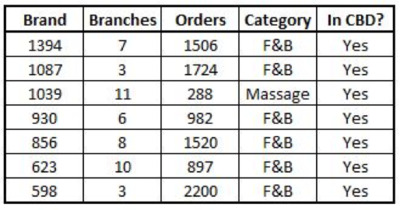
As such, the number of merchants will be shortlisted to those that have more than 3 outlets. After the initial shortlisting, there were 16 merchants in total. Out of the 16 merchants, these were shortlisted further by taking the top 5 in terms of number of branches, as well as the top 5 in terms of orders, resulting in 7 merchants left for analysis.
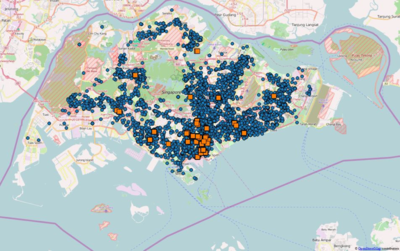
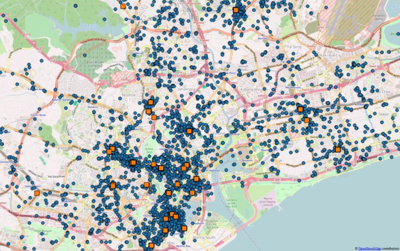
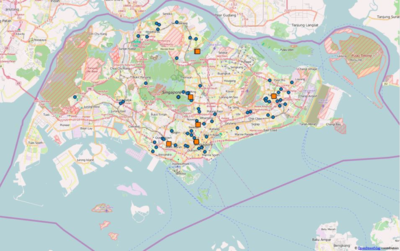
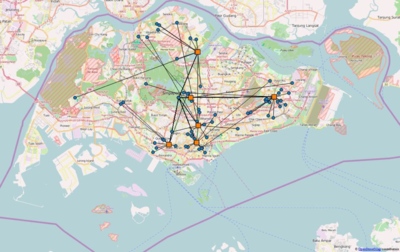
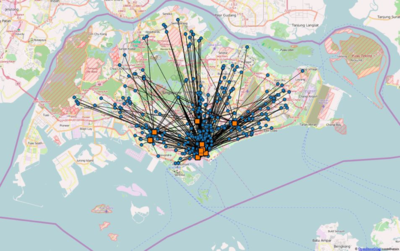
This is a geospatial visualisation of shortlisted merchants and branches (blue circle: orders, orange square: branches)
| Import merchants and orders into QGIS |
As the first two steps (Clean data and short list merchants) were addressed earlier, the model will then carry on with the next step, importing of data.
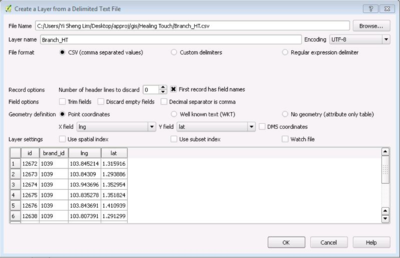
Using database queries, the branches for each merchant, as well as the orders for each merchant/ brand was extracted before being exported into a CSV format to be imported into QGIS. This is done by opening the QGIS software, and navigating the overhead taskbar. Select Layer -> Add Layer -> Add Delimited Text Layer.
This following window should appear. Select the relevant CSV file, and place the longitude of the branch/ order in the X field, and the latitude into the Y field.
| Convert to SVY21 coordinates |
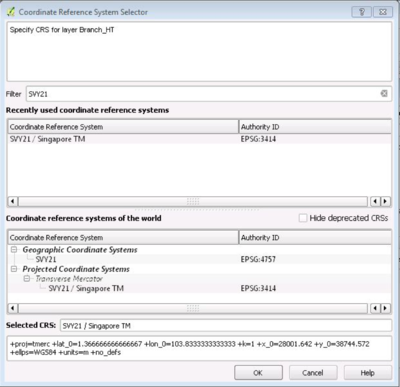
Next, the system will prompt the user to enter the Coordinate Reference Systems. As our target branches and regions are in Singapore, filter for SVY21. This coordinate reference allows us to calculate the distance properly within the geographical context of Singapore.
Upon the import of the order and branch data for the chosen merchant, the visualisation should be like this. For the sake of visualisation, the Singapore map is added in the background to allow a clearer picture of where each branch and order is from. Orders also also styled as blue circles, and branches as orange squares to better highlight these differences. This was edited by right clicking on the respective shape files, selecting Properties -> Styles.
| Generate distance to current branch |
Upon importing the data, a plugin called MMQGIS was used, where two tools within the plugin called Hub Lines and Hub Distances were used to join each branch to their respective orders. The plugin will create a vector from each order node to the branch node, which the distance can then be calculated using QGIS’s field calculator.
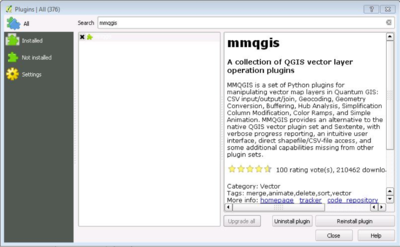
The plugin was obtained by navigating the overhead taskbar and selecting Plugins -> Manage and Install Plugins. Search for “MMQGIS” and the search result was as follows.
The option to install should appear and be selected. Following the installation, the overhead taskbar should have a new tab called MMQGIS. The two tools that required are in MMQGIS Create -> Hub Distance and MMQGIS -> Create -> Hub Lines.
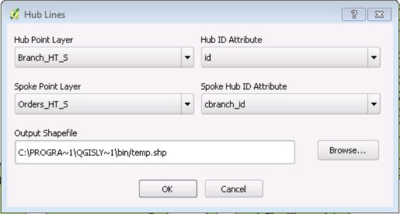
Hub Lines calculates the distance between orders and their respective branches. From the data above, the order dataset has a branch id, which matches with the corresponding id of the branch dataset. The branch is then placed as the hub (the centre), with multiple orders (spoke) going into a branch. The program will then attempt to join the orders to the branch by matching the branch id of the Order file, with the id of the Branch file.
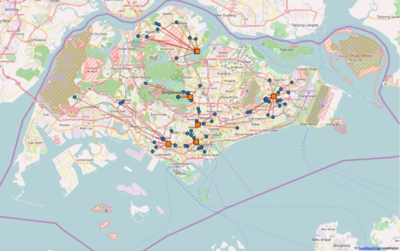
Hub Lines will then output a shape file which places lines on the visualisation.
This allows visualisation to see which orders were going to which branches. However, as of the time that this paper was written, Hub Lines did not calculate the distance automatically, and users had to generate them.
The following few steps will then add the distance to the dataset.
- Right click on the Hub Lines shape file and select Toggle Editing
- Right click on the Hub Lines shape file, and select Open Attributes Table
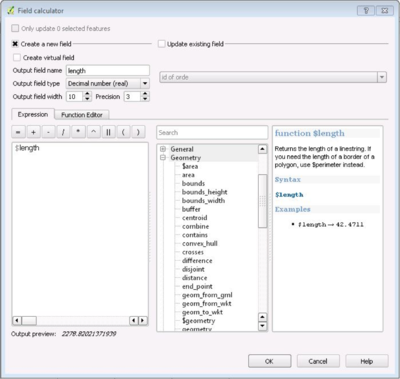
- Move to the end of the overhead taskbar, and select the furthest icon called Field Calculator
- Select the option to Create a new field
- Name the field. In this case, it is named as length
- Select the field type as Decimal number (real)
- Set the precision to 3
- In the bottom middle pane, double click Geometry -> $length, $length should then be added to the left pane
- Click OK
Upon right clicking the Hub Lines shape file and selecting Open Attributes Table, a new column called length should have been added with the distance between the respective orders and branches.
| Generate theoretical shortest distance |
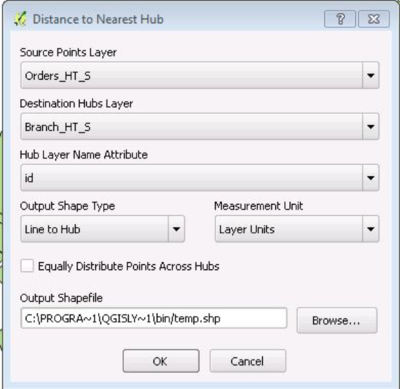
For Hub Distance, it will calculate the nearest possible branch to an order. As such, branches will be the hub of a network, and orders will be the spoke. Each order will then be matched with the nearest branch possible.
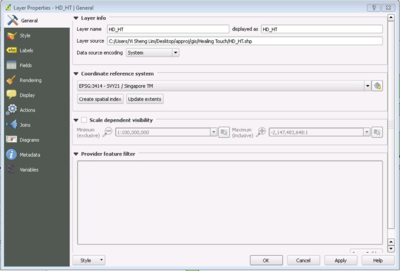
The Hub Distance should add two things to the attribute table, the id of the nearest branch, as well as the calculated distance. The Hub Distance should also generate lines to show the nearest possible route. If no lines are being displayed, right click on the shape file, select Properties -> General, and ensure that the coordinate reference system is set to SVY21.
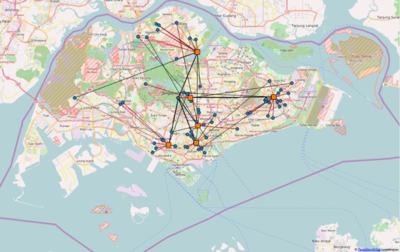
Hub Distance will then output a shape file which places lines on the visualisation.
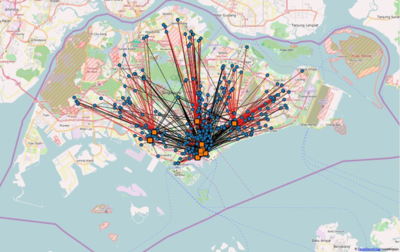
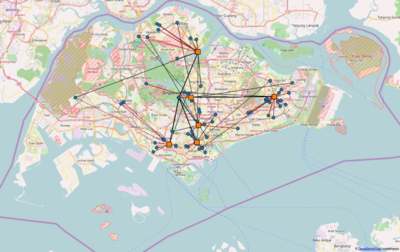
The Hub Line visualisation and Hub Distance Visualisation can be stacked one on top of the other, to visualise the cannibalisation effect.
| Identify merchants with significant cannibalisation |
In order to cross tabulate data, each merchant’s hub lines and hub distance shape files has to be joined together. By using hub lines as the base file, the hub distance can then be joined onto it. This was done by right clicking on the hub line shape file and selecting Properties -> Join. The following window should appear.
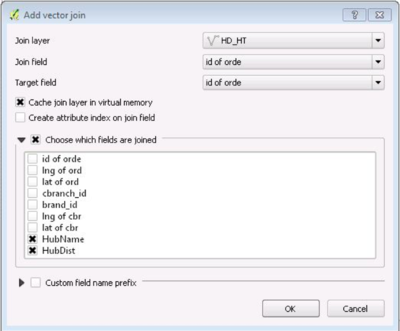
By selecting the green plus button at the bottom left of the window, the vector join window should appear.
By opting to join the Hub Distance on the Hub Lines, the join layer should be the Hub Distance shape file. The join field and target field should be the ID of the orders as the order id is the common aspect of both datasets. Following which, users can then choose which fields to join, which in this case will be the name of the Hub Distance, and the calculated distance of the Hub Distance, in order to prevent repetition of fields. Click OK once done.
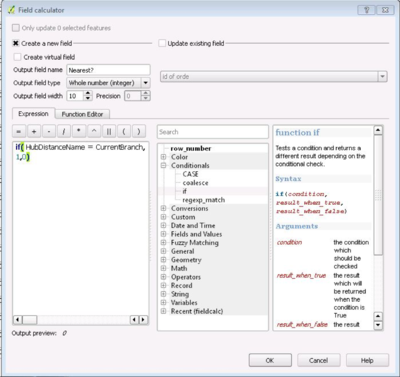
Upon right clicking the Hub Lines shape and selecting Open Attributes Table, the Hub Distance name and Hub Distance distance should be added to the table. In order to calculate whether the current branch of an order, is actually the theoretical nearest branch, the following steps have to be executed:
- Right click on the Hub Lines shape file and select Toggle Editing
- Right click on the Hub Lines shape file, and select Open Attributes Table
- Move to the end of the overhead taskbar, and select the furthest icon called Field Calculator
- Select the option to Create a new field
- Name the field. In this case, we named it as Nearest?
- Select the field type as Whole number (integer)
- In the bottom middle pane, double click Conditionals if
- Input the formula and substitute the fields with the respective Hub Distance name, and the Current Branch name, followed by a 1 and 0. So if the Hub Distance name is equals to the Current Branch name, the value is a 1, else it is a 0.
- Click OK
Upon right clicking the Hub Lines shape file and selecting Open Attributes Table, a new column called Nearest? should have been added with the values of either 1 or 0, indicating whether the current and the nearest branch is the same.
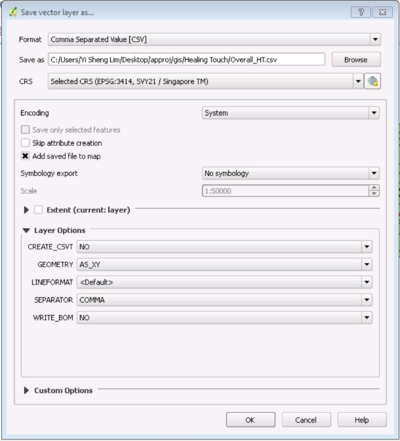
Next, save the data by right clicking the Hub Lines shape and select Save As…; the following window should appear.
The rationale behind saving it as a CSV is because QGIS’s plugin cannot do tabulations on joined tables, and CSV is a format that can be opened in most spreadsheet programs, should any user wish to do this analysis elsewhere.
As the data will be analysed in QGIS, check Add saved file to map, which will add the CSV to QGIS upon saving, for our analysis. The CSV is edited to ensure naming consistency of the fields, which are as follows:
- MerchantID
- CurrentBranchID
- CurrentDistance
- NearestBranchID
- NearestDistance
- Nearest?
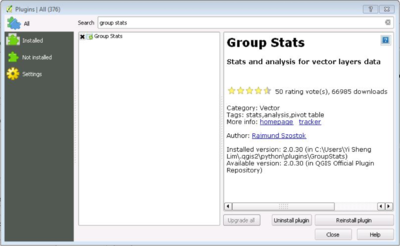
Following which, a plugin called Group Stats is then used to do cross tabulation of results. The plugin was obtained by navigating the overhead taskbar and selecting Plugins -> Manage and Install Plugins. Search for “Group Stats” and the search result was as follows.
The Group Stats plugin can be accessed through the overhead taskbar by selecting Vector -> Group Stats -> GroupStats.
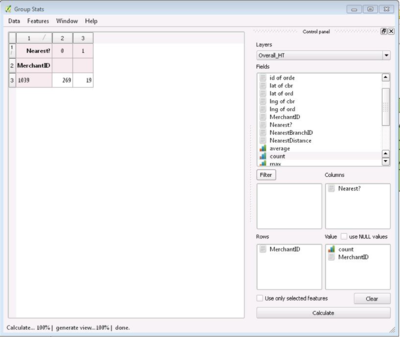
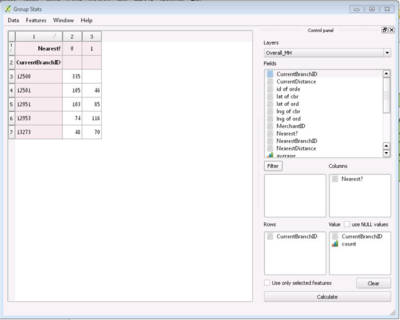
The merchants have to be evaluated and only those with a high cannibalisation rate will be filtered to focus on. This data can be obtained via Group Stat, by dragging MerchantID into the Rows section, Nearest? Into the Columns section, and Count into the Values section. The field of interest (CurrentBranchID) is also dragged into the Values section. Finally, calculate the values.
Repeat this process for all the merchants, and shortlist those that cross a threshold for cannibalisation
| Identify cannibalisation rate of current branches |
Upon identifying which merchants to focus on, users can then drill down to the branch level of each merchant in order to identify which branches are cannibalising the sales of others.
To analyse the extent of cannibalisation of branches, the current branch is plotted against the Nearest? Formula. This is done by placing the CurrentBranchID into the Rows section, Nearest? Into the Columns section, Count and CurrentBranchID into the Values section, before calculating the values.
By doing so, branches that have high rates of cannibalisation can be identified. However, this step cannot identify the specific amount of cannibalisation by a branch, from which other branches.
| Plot current branches against nearest branches |
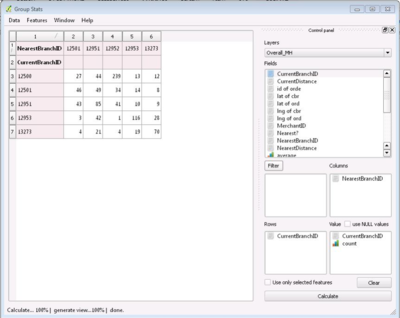
In order to see which branches are being cannibalised by which, the current branch id (CurrentBranchID) is plotted against the calculated nearest branch id (NearestBranchID). CurrentBranchID is placed into the Rows section, NearestBranchID into the Columns section, Count and CurrentBranchID into the Values section, before calculating the values.
From this step, users are able to analyse the extent of cannibalisation for each branch, and the amount that said branch is cannibalising off other branches.
Case Study on Our Client's Merchant Performance
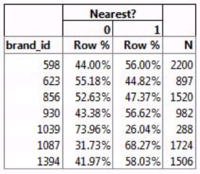
From the shortlisting step, 7 merchants: 1394, 1087, 1039, 930, 856, 623 and 598 were shortlisted respectively. Following the cannibalisation model above, the cannibalisation rate of each merchant can be identified.
As can be seen, all merchants encounter cannibalisation to some extent, but some merchants are more affected by cannibalisation than others, namely merchants 623, 856 and 1039 (cannibalisation rate of above 50%). As such, these merchants will be focused on to examine the causes which may contribute to such instances of cannibalisation.
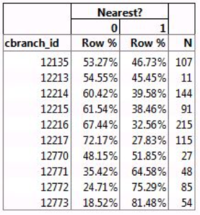
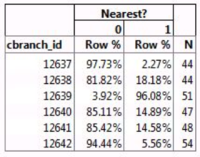
For our analysis, cbranch_id will be the current branch’s ID, and nbranch_id will be the theoretical nearest branch’s ID. Nearest? consists of two values 0 or 1, with 0 being orders that are not the nearest to the branch, and 1 being orders that are closest to the branch.
| Merchant 623 Analysis |
Overview
Merchant 623 is an F&B company which has 10 branches and 897 orders.
Visualisation
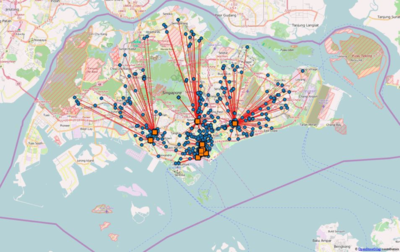
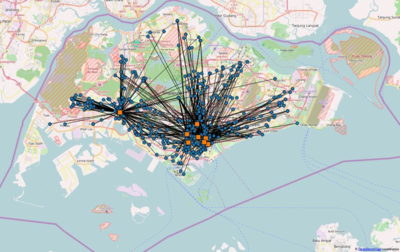
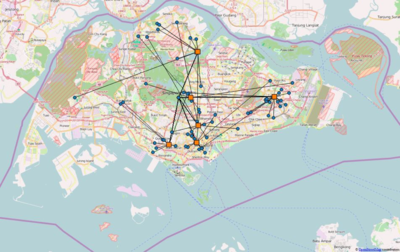
Merchant 623 Visualisation (Current branches to orders)
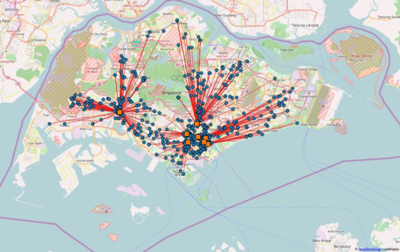
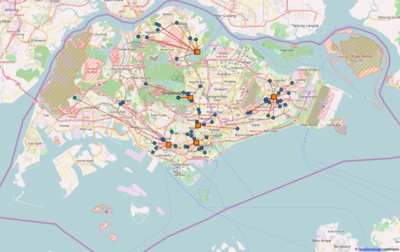
Merchant 623 Visualisation (Theoretical nearest branch to order)
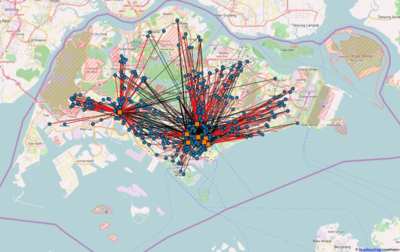
Merchant 623 Visualisation (Combined)
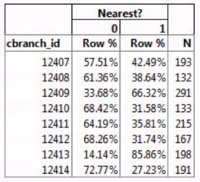
Cannibalisation rate of branches
It can be observed that approximately half the branches cannibalise the sales of other branches to a significantly extent (> 50%). It can also be observed that branches with a large amount of sales (> 100) seem to have a majority of its sales being cannibalised off other branches. This could be because these branches are popular and customers make a special trip down to the store. If this were the case, these popular branches should cannibalise equally from all other stores as the increase in popularity should result in a uniform increase in traffic.
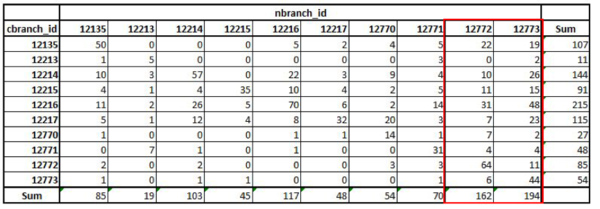
The popular branches are 12135, 12214, 12216 and 12217 respectively. It can be observed by looking at the rows that these branches cannibalise across all branches, which may indicate an overall popularity of these branches, which should redirect sales to the popular branch uniformly.
However, it should also be noted that branch 12772 and 12773 are the most affected by cannibalisation, with 98 and 150 potential sales being cannibalised by other branches from observing the nearest branches column. This could be in part due to the lack of popularity of these branches.
As such, we will recommend for Merchant 623 to look into any ways to firstly, identify what factors could be the resulting difference between the popular branches and the rest, in order to identify any best practices.
Secondly, we will recommend for Merchant 623 to differentiate branches 12772 and 12773 as both these branches are being cannibalised quite heavily by other branches (with no specific culprit). By differentiating both branches, this eliminates the scenario of direct competition between other branches and both shortlisted branches, as the products sold will not be homogenous between the branches. This will thus allowing Merchant 623, and branches 12772 and 12773 to reach out to different segments, and possibly allow for a more even distribution of orders to branches.
| Merchant 856 Analysis |
Overview
Merchant 856 is an F&B company which has 8 branches and 1520 orders.
Visualisation
Merchant 856 Visualisation (Current branches to orders)
Merchant 856 Visualisation (Theoretical nearest branch to order)
Merchant 856 Visualisation (Combined)
Cannibalisation rate of branches
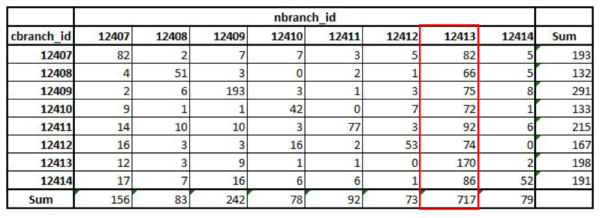
It can be observed that most of the branches cannibalise the sales of other branches to a significantly extent (> 50%). However, it is interesting to note that the two branches that have a low cannibalisation rate (12409, 12413) also have very high number of sales, ranking 1st and 3rd in the terms of absolute sales respectively.
All branches seem to be cannibalising other branches equally, except for branch 12413. Looking at the nearest branch column, branch 12413 seems to be the closest branch to 547 other potential sales that it is not getting. These lost sales are evenly distributed amongst all the other branches. Majority of sales that each branch is cannibalising comes from branch 12413, with approximately 50% of the cannibalised sales being 12413’s sales.
As such, we recommend Merchant 856 to investigate why majority of customers are not going to branch 12413 and are going to other branches instead. Due to the even distribution of cannibalisation, this could be attributed to a systemic issue that will result in a uniform loss of traffic to other branches. This could possibly be due to a lack of awareness of the branch due to push notification errors, which will result in traffic being redirected uniformly elsewhere.
| Merchant 1039 Analysis |
Overview
Merchant 1039 is a massage company which has 11 branches and 288 orders.
Visualisation
Merchant 1039 Visualisation (Current branches to orders)
Merchant 1039 Visualisation (Theoretical nearest branch to order)
Merchant 1039 Visualisation (Combined)
Cannibalisation rate of branches
It can be observed that most of the branches cannibalise the sales of other branches to a significantly extent (> 50%). However, it is interesting to note all the branches have very high cannibalisation, whilst only one branch, 12639, has a very low cannibalisation rate of 3.92%.
All branches seem to be cannibalising other branches equally, except for branch 12639. Looking at the nearest branch column, branch 12639 seems to be the closest branch to 178 other potential sales that it is not getting. These lost sales are evenly distributed amongst all the other branches. Majority of sales that each branch is cannibalising comes from branch 12639, with approximately 90% of the cannibalised sales being 12639’s sales.
As such, we will recommend Merchant 1039 to investigate why majority of customers are not going to branch 12639 and are going to other branches instead. This could be due to the fact that orders may be sent from residential areas (which is where branch 12639 is located), however, customers prefer massage services near their work locations, which will cause this discrepancy. It also has to be noted that if all sales are redirected to branch 12639, there will be little or no sales for the rest of the other branches. As all sales are evenly distributed across all the branches, the current scenario may not be an adverse one.
Conclusion
We have successfully come up with a replicable model, using open source software, for cannibalisation within trade area analysis that others can leverage off from. From the case study’s data, we have validated our methodology as well as discovered various insights into the cases of cannibalisation between branches of merchants, and have offered recommendations and drilled down areas that should be investigated. With this model, merchants will now be able to target problem branches more efficiently as they are now able to firstly, identify problem branches, and secondly, identify which branches are competing and cannibalising the problem branch.
Limitations
This current methodology that we have developed currently relies very heavily on the user having detailed geolocational data in order to analyse the implications of that geographical factors may have on the relationship between orders and branches.
Our model also calculates shortest distance using the as the crow flies method, which is calculated using a very naïve straight line formula. However, shortest straight line distance, may not be hold true when calculated using street distance calculation. However, due to time constraints and computational complexity, we did not attempt to push the model this far.
Our cannibalisation also did not take into account the temporal effects of purchases, where users may act differently during different times of the day
Future Scope
In the future, we can potentially drill down deeper into our shortest distance model by implementing analysis of multi-modal traffic network, and calculating shortest distance using different modes and combinations of transport.
We can also investigate user behavior by comparing geospatial data with time analysis in order to gain insights into the location of user orders at different times of the day.
We can also implement the Gravity Model, where based off attractiveness scores and location of the branch, we will aim to predict the amount of potential user traffic.
Acknowledgements
We thank Prof Kam Tin Seong (Associate Professor of Information Systems; Senior Advisor, SIS) for his insight and guidance throughout this project. We also like to thank our client for graciously providing us with access to his database and staff resources. Lastly, we would like to thank the QGIS community for their invaluable contributions to developing the QGIS software.
References
[1] Achabal, D. D., Gorr, W. L., & Mahajan, V. (1982). MULTILOC-A MULTIPLE STORE LOCATION DECISION-MODEL. Journal of Retailing, 58(2), 5-25.
[2] Capstone. (2003). The Capstone encyclopaedia of business the most up-to-date and accessible guide to business ever. Oxford: Capstone Pub.
[3] Clarke, G. P., & Hayes, S. (2006). GIS and retail location models. Geomarketing: Methods and Strategies in Spatial Marketing, 165-186.
[4] Dibb, S., & Simkin, L. (1994). Retail Store Performance Model the Impact of Own‐branch ‘Friendly Fire’. International Transactions in Operational Research, 1(4), 479-487.
[5] Ghosh, A., & Craig, C. S. (1991). FRANSYS: a franchise distribution system location model. Journal of Retailing, 67(4), 466-498.
[6] Ghosh, A., & McLafferty, S. L. (1982). Locating Stores in Uncertain Environments-a Scenario Planning Approach. Journal of Retailing, 58(4), 5-22.
[7] Ghosh, A., & McLafferty, S. L. (1987). Location strategies for retail and service firms. Lexington, MA: Lexington Books.
[8] O'Kelly, M. (2001). Retail market share and saturation. Journal of Retailing and Consumer Services, 8(1), 37-45.
[9] Öner, Ö. (2014). Retail location.
[10] Retailers, M. M. (1988). Assessing Market Penetration Opportunities.
