IS428 AY2019-20T1 Assign Tommy Johnson Observation2
This section aims to answer the questions posed at the mini challenges
Q2a) Compare uncertainty of the Static sensor to the Mobile sensor. What anomalies can you see? Are there sensors that are too uncertain to trust?
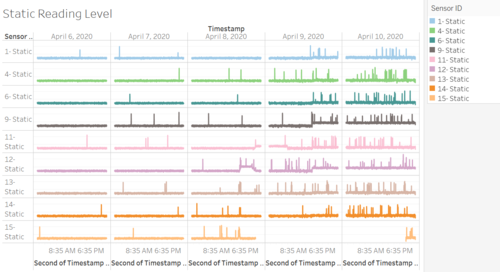
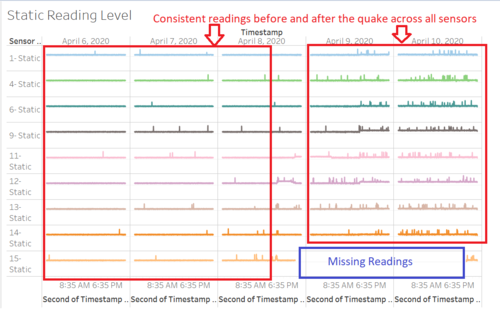
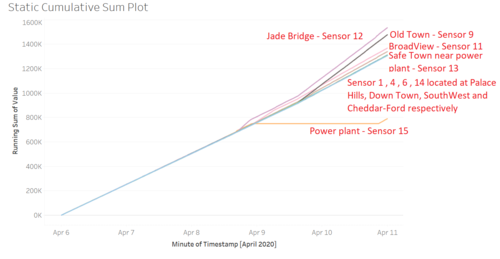
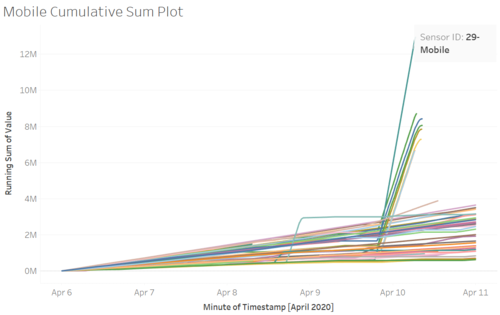
Looking at the static sensor, the sensors appear largely reliable and consistent. Before Wednesday, 8 April around 4:30 PM, all the sensors are stable and have a similar readings with minor random variations. Afterwards, the readings started to have large spikes. This applies to all the static sensors. This may be due to the first quake happened around this time. From this visual, I can conclude that there is not much uncertainty for static sensors. This can be further supported by the CUSUM plot which shows low variation in calibration CPM rate. However, an obvious anomaly exists for Static sensor 15 that shows missing readings between around Wednesday, 8 April 10 PM to around Friday, 10 April 9 PM.
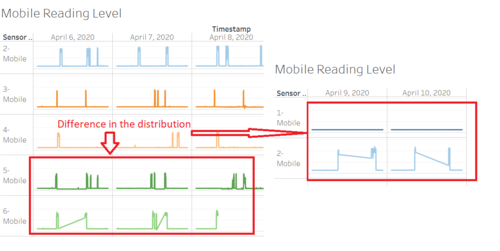
Looking at the mobile sensor, I can see that there is too many variations in calibration CPM rate between the sensors before the probable first quake and even after it happened. For example, let's take a look at Mobile Sensor 5 and 6. There is an obvious difference in the distribution from 6 April until 8 April morning around 7 AM. This shows that there are more background noise for Sensor 6 compared to Sensor 5. Particularly, 8 April at around 7 AM, the readings for Sensor 6 spiked up till 356cpm. However, the readings for Sensor 5 only shows 105cpm. Another obvious difference is between Sensor 1 and 2 on the last 2 days. The readings for Sensor 2 spiked up as high as 1282cpm around 8:10 AM but at that time, the sensor 1 readings only show 400cpm. Hence, the readings between mobile sensors are not reliable and consistent making it uncertain.
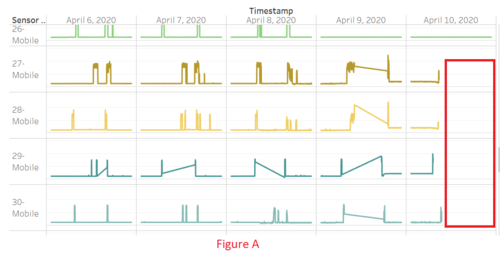
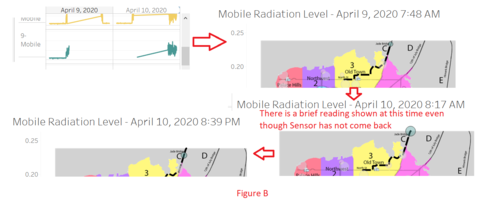
There are quite lots of readings that are missing such as sensor 5, 6, 9, 14, 18 to 25, 27 to 30, 48, and 49. Mostly these sensor readings were missing from 9 April to 10 April morning except for Sensor 18 which has missing readings inconsistently from 6 April to 10 April (See Figure A) . Based on what i observed, these readings are missing because they are out of the map/ leave the city. For example, for Sensor 9 at around 7:49 AM on 9 April, it exited through Jade Bridge. However, something is wrong. on 10 April at around 8:17 AM, the readings appeared for a brief moment and then re appear again at night around 8:39 PM although from the map, it only show that they came back to the city at night. This means the brief reading in the morning is an anomaly and the readings are too uncertain to be trusted (See Figure B) .
There are also a lot of background noise from Sensor 12,19,20,21. This can be seen from the wider gap on these sensors. Hence, these sensors should be treated with caution.
Q2b) Which regions of the city have greater uncertainty of radiation measurement? Use visual analytics to explain your rationale.
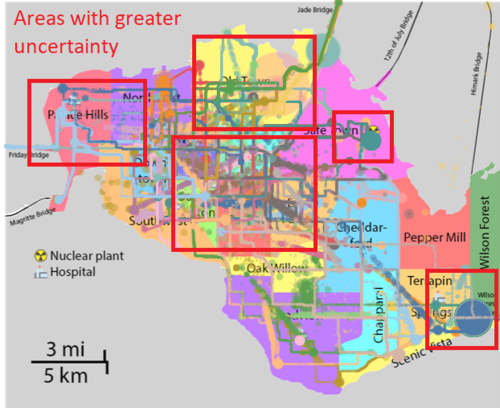
Looking at the regional reading level map, the areas that may have greater uncertainty will be around the North East of Safe Town (In the vicinity of the power plant. As mentioned in the previous answer, Static Sensor 15 which is located around the area has long period of missing data. This means I cannot say for sure that the readings around this area is reliable especially if the high readings are more contributed by the mobile sensors.
Another area that shows uncertainty will be at Wilson Forest. This area is very far away from the power plant and yet it has a high readings at a certain point in time. Hence, it cannot be said to be reliable as well.
A large part of the central areas like Northwest, through Weston, Easton, Southton, West Parton, East Parton and Palace Hills also shows diverse readings which are unlikely contributed by the environmental causes. It is more likely contributed by the incorrect fluctuation of readings caused by the mobile sensors.
A large spike seen around Old Town should be paid more attention. This area has the highest probability of having reliable readings due to its location near the power plant and some other evidence that reveals it is associated with the environmental causes.
Q2c) What effects do you see in the sensor readings after the earthquake and other major events? What effect do these events have on uncertainty?
Using the static reading level by log scale, I can see a general increase in the readings across the sensors from 8 April at around 4:30 PM. There are increasing background noise around this period. Hence, I deduce that the earthquake happened around this period.
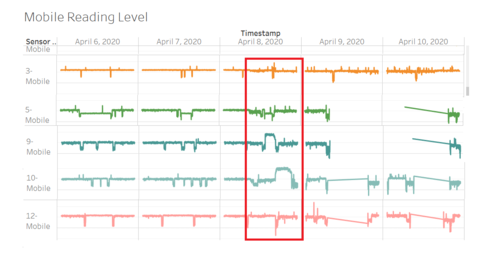
However, by looking at the mobile sensors, I observed that there are readings that were decreasing instead after the earthquake. For example, Sensor readings 3,5,9,10 that shows a major spikes during the earthquake. However, it does not sustain for very long and began to decrease subsequently. Additionally, Mobile Sensor 12 decreases to 0 cpm during the earthquke instead. Hence, these sensors shows their unreliability and the confidence in the recorded value.

