IS428 AY2019-20T1 Assign Tommy Johnson Observation3
This section aims to answer the questions posed at the mini challenges
Q3a) Highlight potential locations of contamination, including the locations of contaminated cars. Should St. Himark officials be worried about contaminated cars moving around the city?
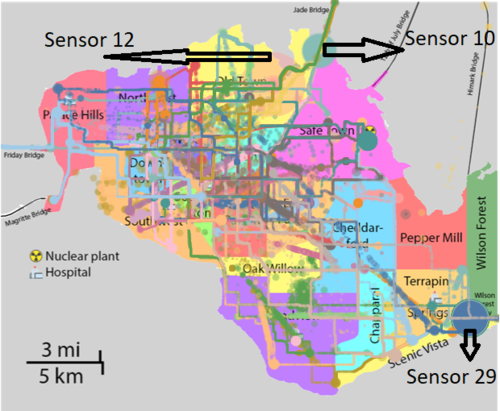
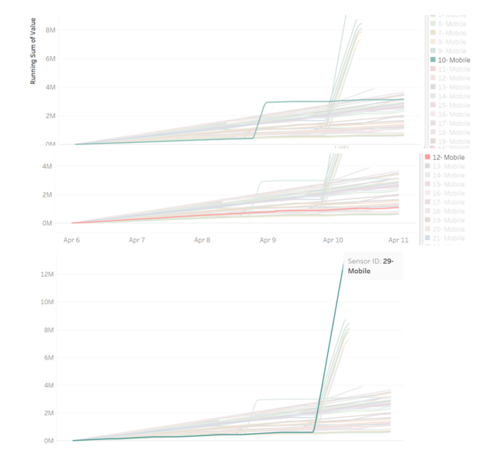
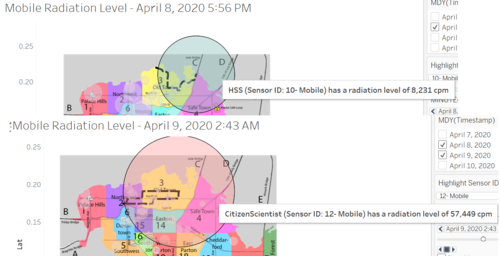
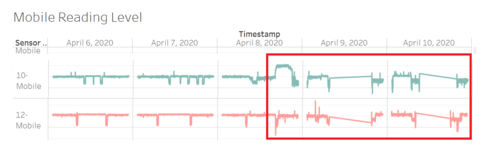
The potential locations of contaminated cars are at Wilson Forest (9 April, 6 PM to 10 April, 6 AM) largely caused by Mobile Sensor 10 and the Jade Bridge (8 April, 4:37 PM to 10 PM) largely caused by Mobile Sensor 29. The other potential contaminated car is at Old Town contributed by Mobile Sensor 12 on 9 April at around 2:43 PM. However, Sensor 12 has a low reliability in its reading based on the answers given in Q2c. Other areas of contamination would be at Safe Town where the power plant is located.
Q3b) Estimate how many cars may have been contaminated when coolant leaked from the Always Safe plant. Use visual analysis of radiation measurements to determine if any have left the area.
Jade Bridge
Mobile Sensor 10 is the only vehicles that is strongly contaminated. There might be a small possibility of cross contamination to the Mobile Sensor 12 which caused it to have the highest readings. This is because both vehicles share similar locations over the three days.
Wilson Forest Highway For the Wilson Forest Highway incident, there are multiple cars contaminated. They are namely (In Descending order of contamination level): Sensor 29,21,45,25,27,28,22,24. In addition, Mobile Sensor 30 is also contaminated but at a much lower level.
Initially, most of the vehicles come from Scenic Vista except for Mobile Sensor 29 from Terrapin Springs at around 9:26 AM towards the highway. By 10 AM, all vehicles has left and readings are not noticeable. Sensor 30 do not leave the area and stays throughout the days. Around 6 PM onwards, all cars started to come back from the highway and the readings started to spike.
Q3c) Indicate where you would deploy more sensors to improve radiation monitoring in the city. Would you recommend more static sensors or more mobile sensors or both? Use your visualization of radiation measurement uncertainty to justify your recommendation.
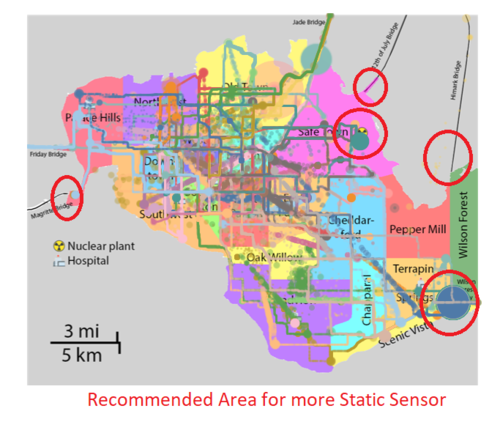
As it has already been discussed in the previous questions, most of the radiation contamination occurred were happening in the mobile sensors. There are also a lot of uncertainty for these sensors. Adding on, mobile sensors are more likely to cause cross contamination between cars especially the government could not control the movement of the cars. Hence, this may create more areas to be contaminated. Hence, I would recommend to put more static sensors instead as it i more reliable and consistent. The static sensors can be put around the exit of HiMark Bridge, 12th of July Bridge, Magritte bridge. This is because these bridges have low contamination currently. It would be good to monitor cars that exit and arrive to the city so that preventive measures could be taken to avoid more contamination. Since there was a noticeable high readings level at Wilson Forest , static sensors can be put here to confirm the location contamination. Static sensor 15 could also be looked into and fixed so that it can get the reading throughout the days and not missing.
