IS428 AY2019-20T1 Assign Tommy Johnson Observation4
This section aims to answer the questions posed at the mini challenges
Q4) Summarize the state of radiation measurements at the end of the available period. Use your novel visualizations and analysis approaches to suggest a course of action for the city. Use visual analytics to compare the static sensor network to the mobile sensor network. What are the strengths and weaknesses of each approach? How do they support each other?
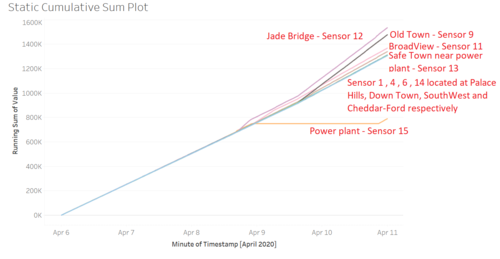
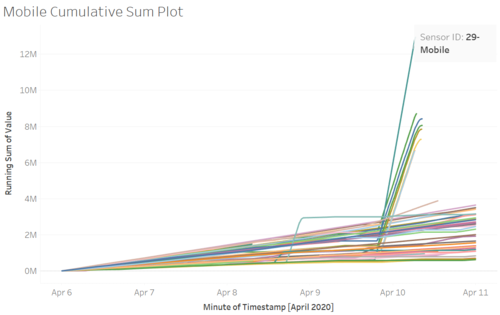
Looking at the Cumulative Sum plot, it summarize the status of the monitored readings at the end of the period. Overall, I can summarize as below:
- A raised background radiation level persists throughout the region. This is approximately a doubling of the normal background radiation level (evidence from all static sensors provides the absolute CpM figures; all sensors provide the relative changes)
- Two hotspots persist at Jade Bridge and Old Town (evidence from static sensors). The priority should be to decontaminate these two areas, if necessary closing off Jade Bridge until decontamination is complete. This is to prevent further serious contamination as well.
- The Wilson Highway vehicles (Sensor 29,21,45,25,27,28,22,24,30) should be the priority for decontamination.
Overall, Static sensors provide reliable and consistent readings throughout the 5 days. They are also useful in detecting other vectors such as wind and water. However, as they are static, they can only be placed at a fixed location. Hence, providing lesser coverage. This is where the Mobile sensors are useful. They have greater coverage as compared to Static sensors. Due to its mobility, it is even possible to monitor readings outside of Hi Mark city. However, They are especially useful only when the car on which the sensors are mounted to is the vector of contamination. There is limitations to which vector they can consider. Other than that, the proven unreliability and inconsistency readings may decrease the confidence of the people to even use it.


