Difference between revisions of "IS428 AY2019-20T1 Assign Tommy Johnson Observation"
Jump to navigation
Jump to search
(Created page with "<div style=background:#f79b4c border:#A3BFB1> 200px <font size = 5; color="#000000"><b>Visualization Analysis on Always Safe nuclea...") |
|||
| Line 41: | Line 41: | ||
|} | |} | ||
This section aims to answer the questions posed at the mini challenges | This section aims to answer the questions posed at the mini challenges | ||
| − | + | ==Visualize radiation measurements over time from both static and mobile sensors== | |
To answer this question, you may look at the <b> Radiation Level by Map Chart </b> and <b> Readings Level by sensor type </b> | To answer this question, you may look at the <b> Radiation Level by Map Chart </b> and <b> Readings Level by sensor type </b> | ||
Revision as of 14:28, 6 October 2019
 Visualization Analysis on Always Safe nuclear power plant
This section aims to answer the questions posed at the mini challenges
Visualize radiation measurements over time from both static and mobile sensors
To answer this question, you may look at the Radiation Level by Map Chart and Readings Level by sensor type
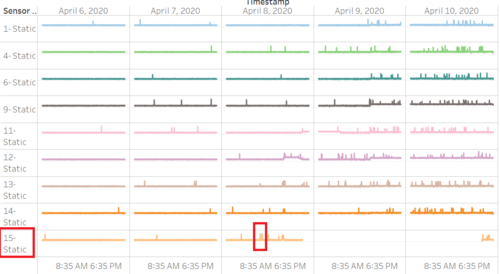
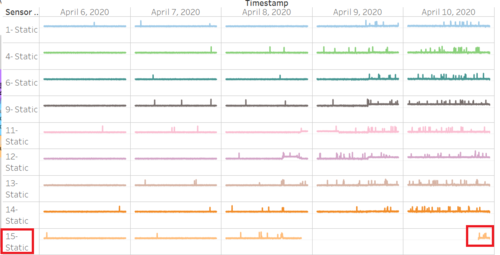
- I found out that the highest readings level for static sensor comes from sensor 15-Static at 1,238 cpm on 8 April 2020 at 10:20 AM

- The lowest reading level for static sensor comes from sensor 15 - Static at 112 cpm on 10 April 2020 at 8:45 PM

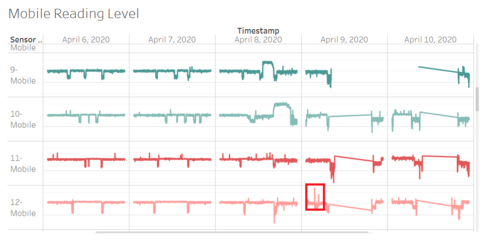
- The highest readings level for mobile sensor comes from sensor 12-Mobile at 57,449 cpm on 9 April 2020 at 2:43 PM

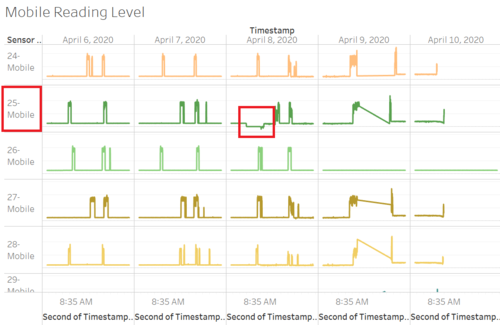
- The lowest reading level for mobile sensor comes from sensor 25-Mobile at 0 cpm across both 8 April 2020 AT 8:47 pm
