ISSS608 2018-19 T1 Assign Lee Yeng Ling Task 2 Insights
|
|
|
|
|
|
|
|
Task 2: Spatio-temporal Analysis of Citizen Science Air Quality Measurements
Using appropriate data visualisation, you are required will be asked to answer the following types of questions:
- Characterize the sensors’ coverage, performance and operation. Are they well distributed over the entire city? Are they all working properly at all times? Can you detect any unexpected behaviors of the sensors through analyzing the readings they capture? Limit your response to no more than 4 images and 600 words.
- Now turn your attention to the air pollution measurements themselves. Which part of the city shows relatively higher readings than others? Are these differences time dependent? Limit your response to no more than 6 images and 800 words.
Characteristics of Sensors: Performance & Operations
Summary of dataset measurements statistics is shown in figure below.
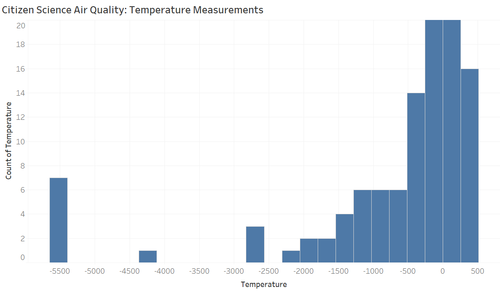
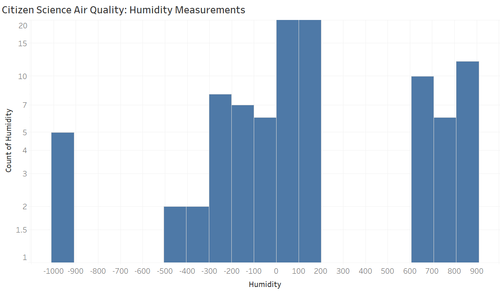
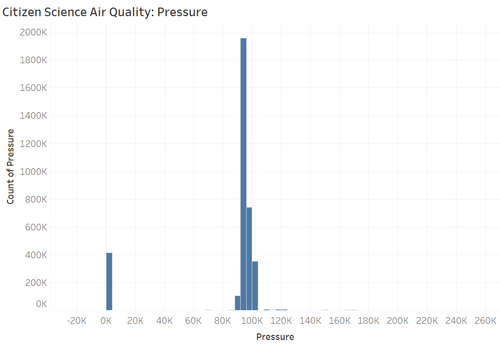
Temperature, Humidity and Pressure histograms are as follows:
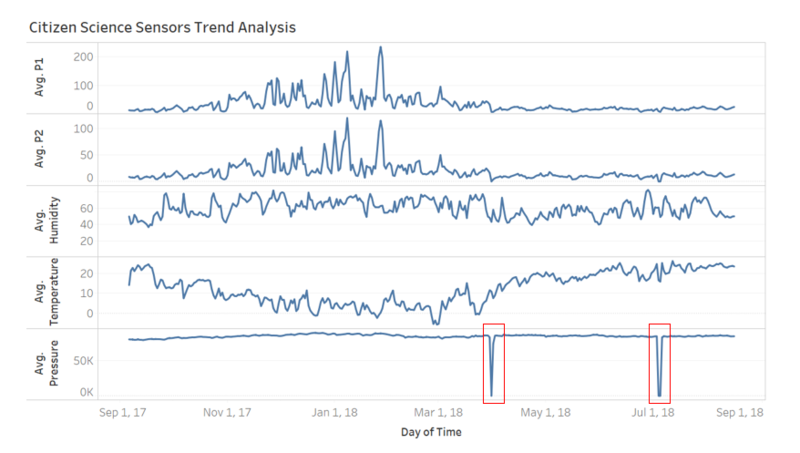
One-year Trend analysis of P1, P2, Temperature, Humidity and Pressure ->
Observations made of the above charts:
- Temperature. There are erroneous readings where temperatures range from -500 to -5500.
- Humidity. It is known that Sofia has some extremely humid months, with other moderately humid months on the other side of the year. The least humid month is August (about 48% relative humidity), and the most humid month is December. However, the negative readings and readings exceeding 200 for humidity are likely to be erroneous.
- Pressure. The readings of zero values (highlighted in red) are likely to be the sensor malfunctioning.
Citizen Science: P1 & P2 Pollutant Distribution
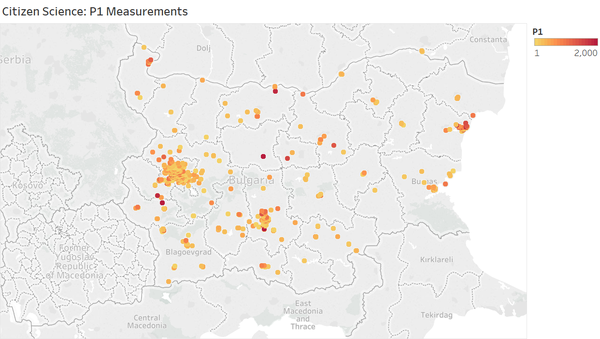
| P1 Distribution (Period: 6 Sep 2017 to 16 Aug 2018) Figure below shows the Citizen Science Air Quality sensors readings coverage for Bulgaria |
P2 Distribution (Period: 6 Sep 2017 to 16 Aug 2018) Figure below shows the Citizen Science Air Quality sensors readings coverage for Bulgaria |
|---|---|
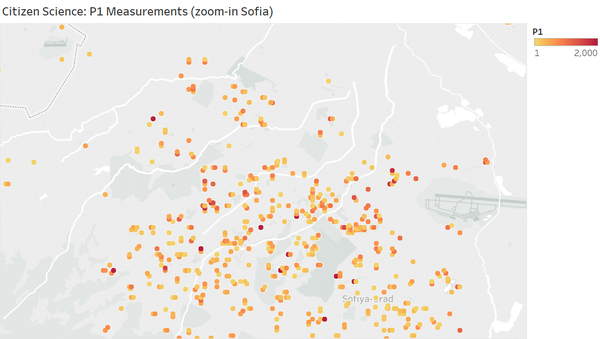
| P1 Distribution (Period: 6 Sep 2017 to 16 Aug 2018) Figure below shows the Citizen Science Air Quality sensors readings coverage for Sofia It does show that there is adequate coverage for Sofia by sensors. |
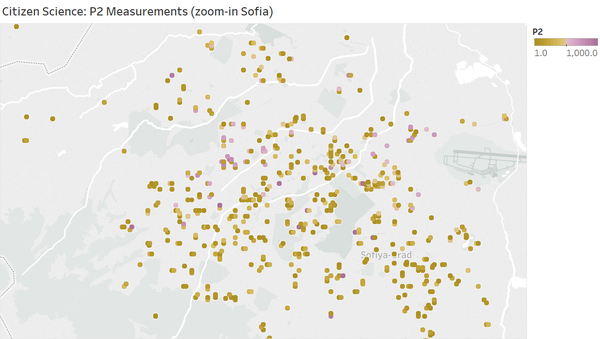
P2 Distribution (Period: 6 Sep 2017 to 16 Aug 2018) Figure below shows the Citizen Science Air Quality sensors readings coverage for Sofia It does show that there is adequate coverage for Sofia by sensors. |
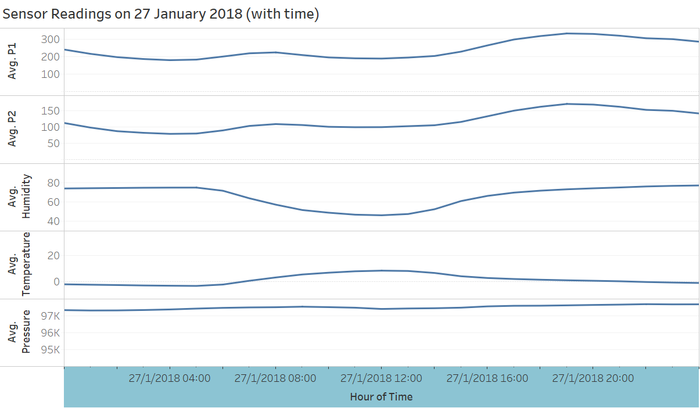
From the above P1 & P2 pollutant distribution as well as calendar view from Task 1, it can be observed that the part of the city at the heart of population (near to Hipodruma Sofia & Orlov Most Sofia) have higher readings and more polluted. Higher readings are also recorded when the traffic are at its peak hours of the day.
Figure below illustrate the P1 & P2 variation with temperature, humidity, pressure over time on a selected day 27 Jan 2018 which has a high PM10 mean value of 261.


