ISSS608 2018-19 T1 Assign Lee Yeng Ling Data Overview & Preparation
|
|
|
|
|
|
|
|
The datasets provided for this assignment are:
| Dataset Description | Metadata Description |
|---|---|
| 1. Official air quality measurements (5 stations in the city) | The measurement datasets of 6 air quality monitoring stations are provided (see Table 1: List of Monitoring Stations). These measurements are as per EU guidelines on air quality monitoring. Table 1
Four stations (BG0040A, BG0050A, BG0052A, BG0073A) have data from year 2013 to 14 September 2018. While station BG0054A contained daily data from years 2013 to 2015 and station BG0079A only have hourly data from 1 January to 14 September 2018. Up till 31 December 2016, the measured values (ie. concentration) of air pollutant PM10 at all station were taken on daily basis. From 28 November 2017 onwards, the concentration values were measured on hourly basis. For analysis, the datasets from 2013 to 2018 of all air quality stations are concatenated and 4 new column variables (namely, "Station Name", "lat", "lng", "AQI") are added to the dataset. The new variables are the Station Names, latitude (lat) and longitude (lng) of the stations, and the Air Quality Index (AQI) of the measurements. The metadata is shown in Table 2a and 2b (new created variables). Table 2a
Table 2b
|
| 2. Citizen science air quality measurements (Air Tube.zip) | Bulgaria runs 40 monitors of PM10 in its official network for monitoring air quality. However, since authorities have failed to improve air quality for years, citizens have become engaged in large numbers. They now carry out their own monitoring of PM10 and PM2.5 with more than 300 monitors in Sofia and around the country. A sample metadata is shown in Table 3. Table 3
In order to obtain the latitude (lat) and longitude (lng) of geohash points, geohash package in R is used to geocode a csv file of geohash addresses. |
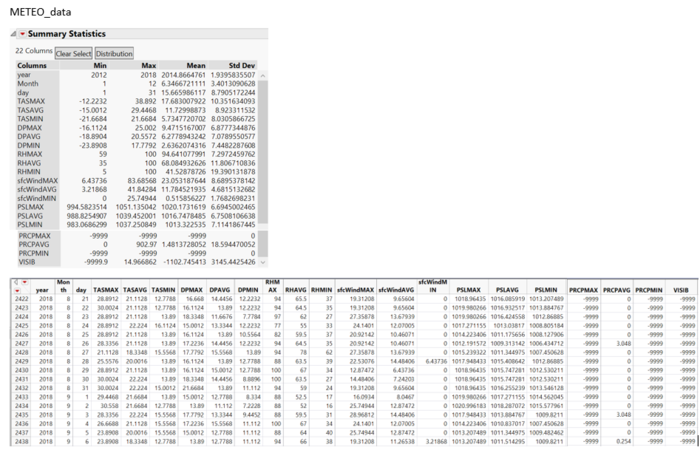
| 3. Meteorological measurements (1 station) (METEO-data.zip) | |
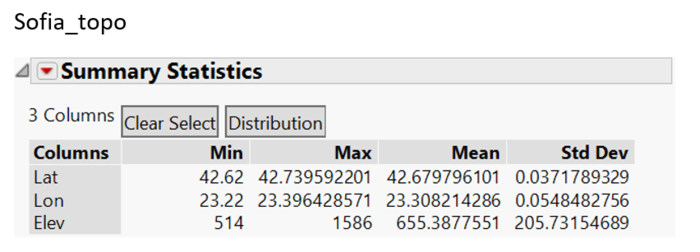
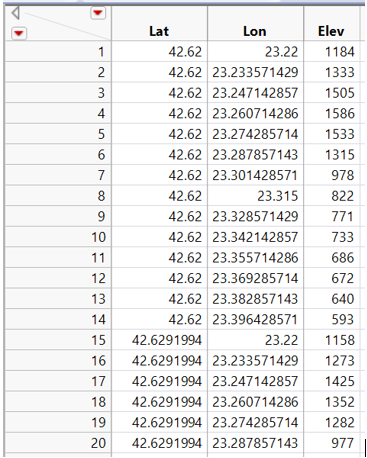
| 4. Topography data (TOPO-DATA) |


