ISSS608 2018-19 T1 Assign Lee Yeng Ling Application Design
Jump to navigation
Jump to search


Spatio-temporal Analysis of Air Quality in Sofia City
|
|
|
|
|
|
|
|
Application Design
The data story and visualization is developed and presented using Tableau. Visit the interactive Tableau application here Task 1 and Task 2
===== Methodology ======
- Navigation in Tableau by selection of Tab comprising dynamic dashboards. All views are dynamically shown with various selection of parameters of interest.
- Parameters of Interest for selection are created to allow dynamic view with choice of interested parameters as shown in Table 1:

===== Dashboard Design ======
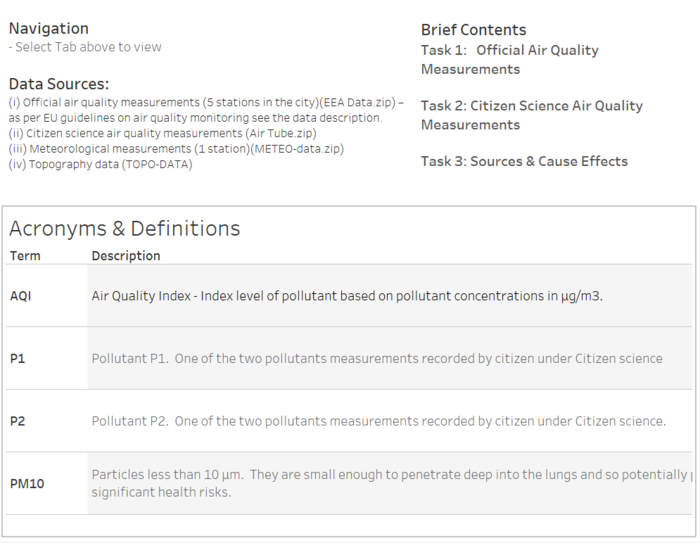
- Instructions & Content Tab provide instructions, acronyms & definitions and content of application. See below for summary of the content coverage:
