ISSS608 2018-19 T1 Assign Lee Yeng Ling Task 1 Insights
|
|
|
|
|
|
|
|
Contents
Task 1: Spatio-temporal Analysis of Official Air Quality
'Characterize the past and most recent situation with respect to air quality measures in Sofia City. What does a typical day look like for Sofia city? Do you see any trends of possible interest in this investigation? What anomalies do you find in the official air quality dataset? How do these affect your analysis of potential problems to the environment?
Your submission for this questions should contain no more than 10 images and 1000 words.
About Sofia
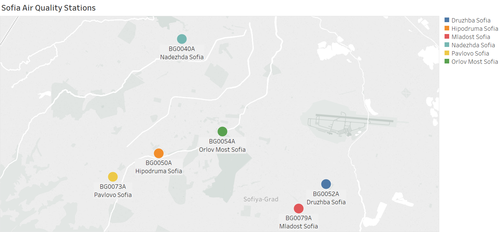
Sofia, the capital of Bulgaria, is situated in a hollow valley at the skirts of the Vitosha mountain with population of about 1,300,000 people. The unfavourable meteorological conditions in the city, which is the most densely populated area in the country, surrounded by mountains up to 2,500m high, are combined with a number of different industrial, traffic and domestic air pollution sources which are subject to various monitoring programs and investigations.
About Sofia Pollution Issue
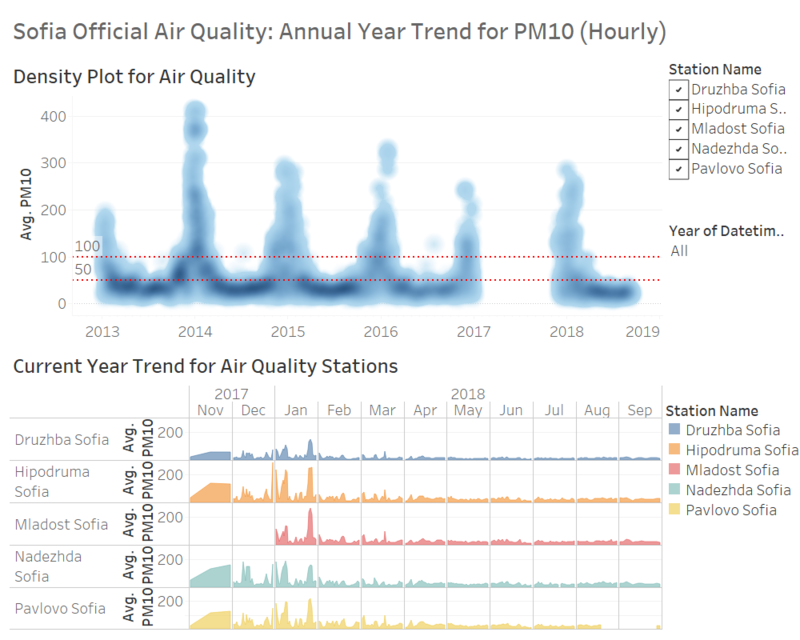
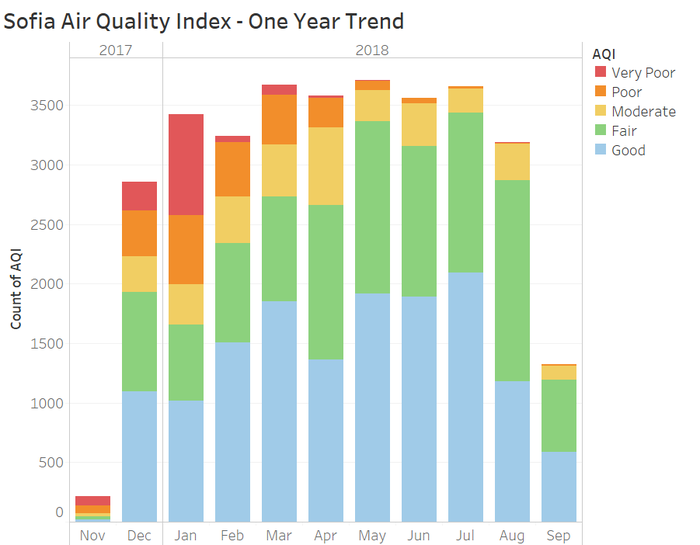
The national legislation following the EU Directive 2008/50/EC sets PM10 daily limit values of 50 μg.m3, not to be exceeded more than 35 times per calendar year. During 2012 and 2013, the mean annual PM10 concentration was above the limit value of 40 μg.m3 in all Sofia urban stations. The number of days with exceedances at five automatic monitoring stations varied between 59-108 days in 2012 and 62-110 days in 2013 (Report RIEW, 2013). Then air pollution with particulate matter in Sofia is characterized by a distinguished seasonal pattern with peaks during the cold period (winter season) of the year. This has been because of higher emissions from domestic heating during winter and more intensive urban traffic. Minimum concentrations are observed in the summer months, when the mixing conditions in the atmosphere are better and the source emissions are reduced. This has highlighted the need to evaluate the level of particulate pollutants spatially for policy and management action to reduce the air pollution levels in Sofia.
Annual Trend of Official Air Quality
|
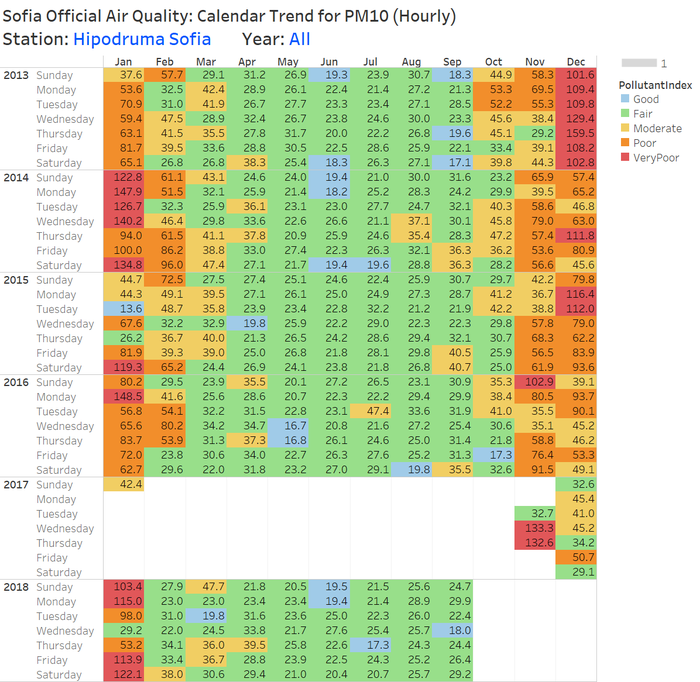
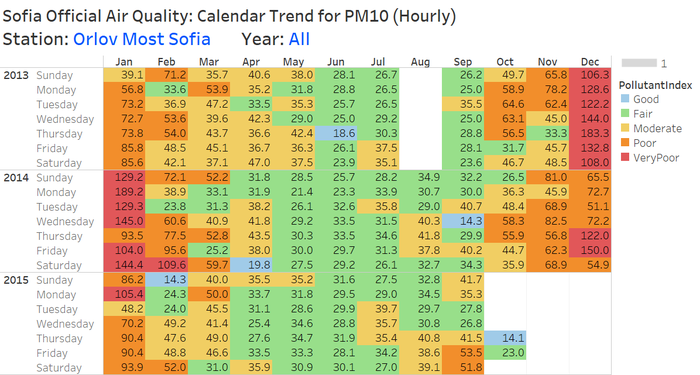
Calendar Trend of Official Air Quality
| |
Potential Concerns Arising from Trend Analysis
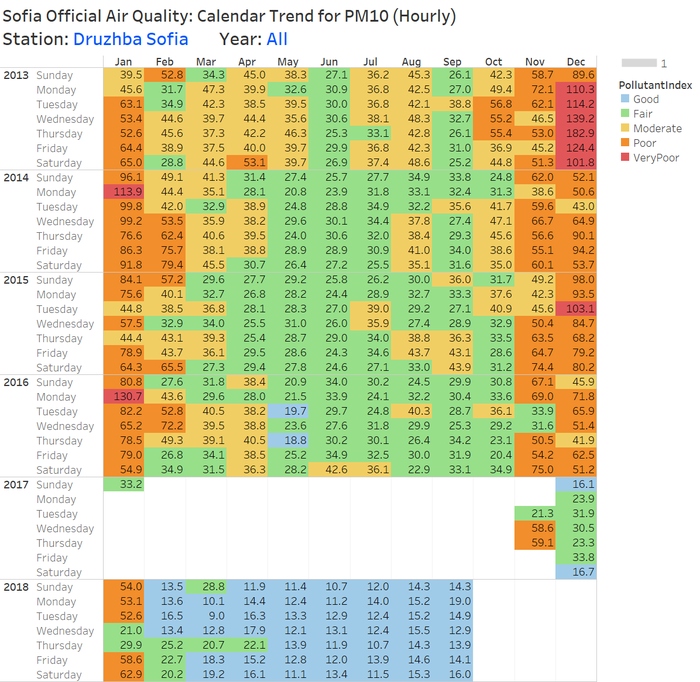
The calendar view trends showed quite a large patch of AQI "Fair" (green) across all 5 air quality stations. However, these readings don't seem to reconcile (or too good to be "True") with the sentiments of population in Sofia city. Therefore, we will compare with the measurements from the Citizen Science Air Quality sensors readings in Task 2 before we could make further assessment.

