ISSS608 2018-19 T1 Assign Goh I Vy Conclusion
|
|
|
|
|
|
Conclusion
Let us put things into perspective and take a step back into year 2015. 20th October 2015, Today reported that Singapore’s haze situation took a turn for the worse with both PM2.5 and three-hour PSI was reported to be 471 in western Singapore. In Singapore, the PSI is an index computed based on the 24-hour average of PM2.5 concentration levels, among other pollutant. PM2.5 is the dominant pollutant during haze episodes. [1]
Juxtoposed to Europe, Singapore measures its air quality in terms of PSI rather than the AQI index. In Singapore, the PM2.5 concentration is monitored as it have a more adverse impact on health, especially to the young, the elderly and the sensitive (people with asthma).
Impact of "Hot Spots"
From the dataset, the "Hot Spots" were identified, but at the end of the day, how does it impact the citizen in Sofia? Air pollution is detrimental to health and more specifically to the young, the elderly and the sensitive. As such, it is important to identify where are these "Hot Spots" and how close proximity are they to these category of people.
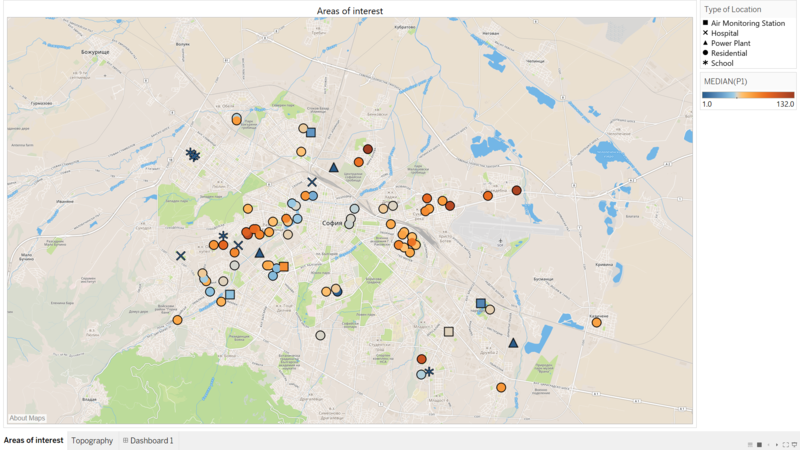
A dataset consisting of Longitude and Latitude data is created by selecting the prominent "Hot Spots" from Citizen Science Air Data and Official Air Quality dataset for the month of January 2018. Around the vicinity of these "Hot Spots" areas, location such as schools and hospitals are identified using Google Map. Location of power plants are also identified. [2]
From the image above it can be observed that there are indeed area where there are Schools and Hospitals where the residential area were identified as "Hot Spots". Especially at the North West region, which is also close proximity to a power plant. Also noted that areas identified in Task 2 which is North of Sofia City have a Power Plant at that area (near Nadezha). Areas at South East of Sofia City that do appear as a "Hot Spots" at times have another Power Plant at that area.
In conclusion, perhaps the Air Quality Monitoring in Europe should also pay attention to PM2.5 concentration as it have adverse health effect on these category of people. Actions that could be taken by citizens is to install more sensors at that area to be able to collect more data and hopefully better quality data. Official Air Monitoring Station should also be increased to these areas.
Lessons Learnt
In analyzing the multiple dataset, it is important to be able to join several dataset together to allow a better visualization of data as a whole. Interactivity could have been further build in the dashboard and story board for better user interface and better visualization as well. However due to time limitation, most of the dashboard and story board are not very interactive, but mainly to illustrate comparison between data.
Banner image credit to: AFP News Agency

