ISSS608 2017-18 T3 Assign Yejerla Amrutha Rajeshwari eye
Jump to navigation
Jump to search
|
|
|
|
|
|
|
Now, I see
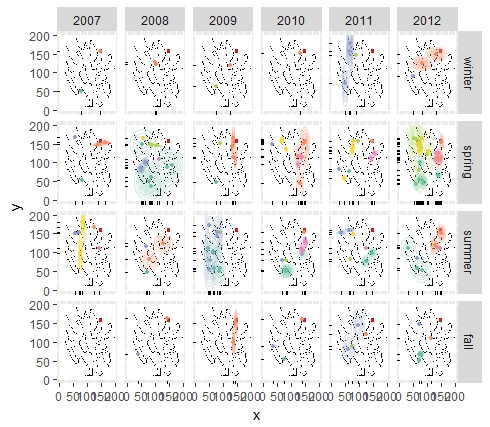
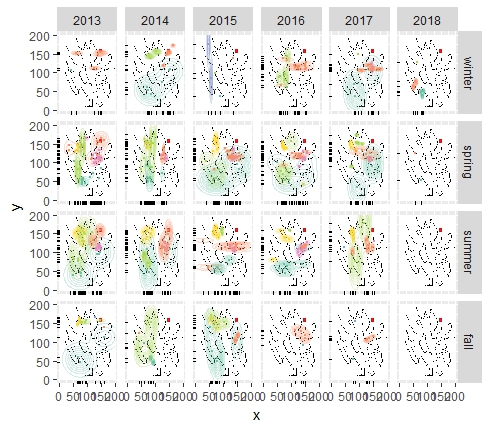
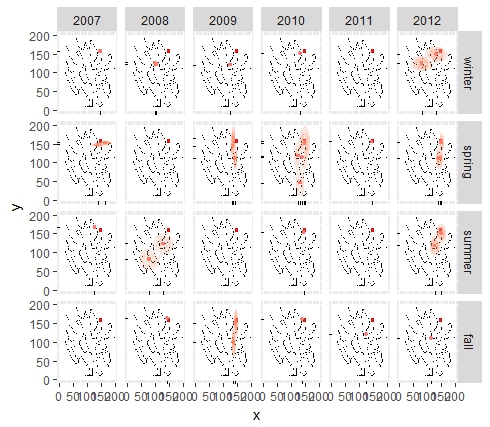
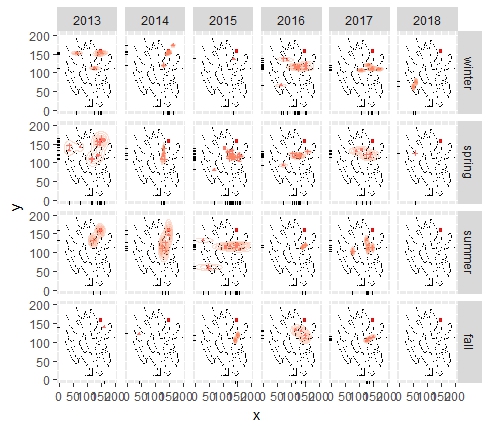
Based on insights from initial exploration, the recording are further investigated with custom visualizations in R. Faceting technique is used to be able to compare observations across time frames.
Steps followed
- Lekagul Roadways graph is loaded on to R and after setting the axis, map is plotted on the graph using geom_raster. A rectangular geom of about 9x9 pixels is overlaid on the graph to mark the alleged dumping site.
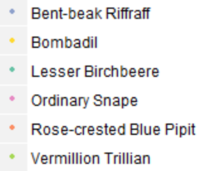
- The species that we want to study further i.e. Rose-crested Blue Pipit, Bombadil, Bent beak Riffraff, Lesser Birchbeere, Vermillion Trillian, Ordinary Snape are plotted on the graph.
- Colours of points on the graph are mapped to Species and the 2d density attribute with the same colour is added for each species.
- Resultant plot is faceted using a season modified_year layout
- Rugs are added as an visual aid.
Please note that the data is available only till spring 2018 and hence summer, fall 2018 do not have any records to show.
Insights
- Across All Birds:
- Bombadil birds have not moved much and the number of recordings are decreasing.
- Lesser Birchbee birds seem to be actively moving around the park. They seem to have two clusters one nearer to the alleged location and the other far south.
- Ordinary snape seems to be active in the month of spring and summer and there is no conclusive evidence that their population is falling.
- Vermillion trillion seems to move back and forth the alleged region. Their Vocalization distribution has to be further investigated to understand their behaviour.
- A closer look at Rose Crested Blue Pipit reveals following patterns:
- Rose-crested Blue Pipit have been recorded at the alleged dumping site consistently for years. However, they also seem to move down south in few of the seasons.
- Having said that, they have never returned back to the dumping site after summer 2014. It is possible that the alleged dumping took place around this time or the aftereffects exaggerated at this time.
- Given that, these birds are active in the months of spring and summer, dumping episode could have happened between summer 2014 and spring 2015.
- Also the no of recordings in 2015 alone are very high causing suspicion. Historically, there have been more songs recorded in spring for Rose Crested Blue Pipit than calls. Analysis of Vocalization types will facilitate further analysis.
Vocalization Distributions
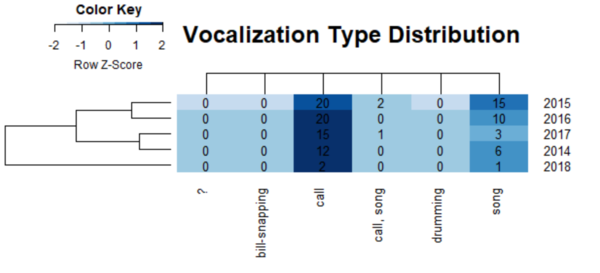
Following is the distribution through years 2014 to 2018(till spring).
Following is the distribution through years 2008 to 2018(till spring).
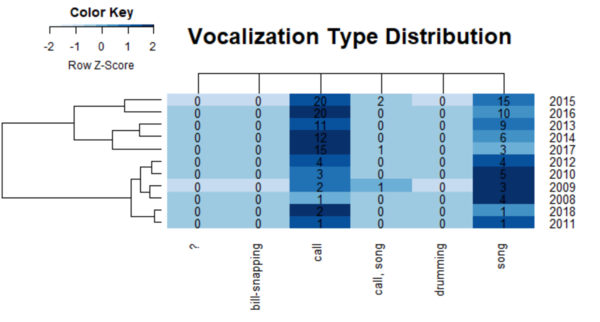
From the heatmap it is evident that number of calls have increased after the dumping that has happened around 2015. However, birds seem to recover from the trauma in recent years as there is increase in the proportion of songs.
