ISSS608 2017-18 T3 Assign Yejerla Amrutha Rajeshwari eda
Jump to navigation
Jump to search
|
|
|
|
|
|
|
Assumptions
- The count of recordings are representative of the bird population for each species.
- Since the number of recordings are very low for the initial years and the quality of data collection is not good enough, records starting from 2007 only are considered for analysis. However, the proportion of vocalization types of previous years records are useful.
- We do not know the actual dumping site or the extent of land/resources impacted by the dumping of chemicals.
Data exploration using Tableau
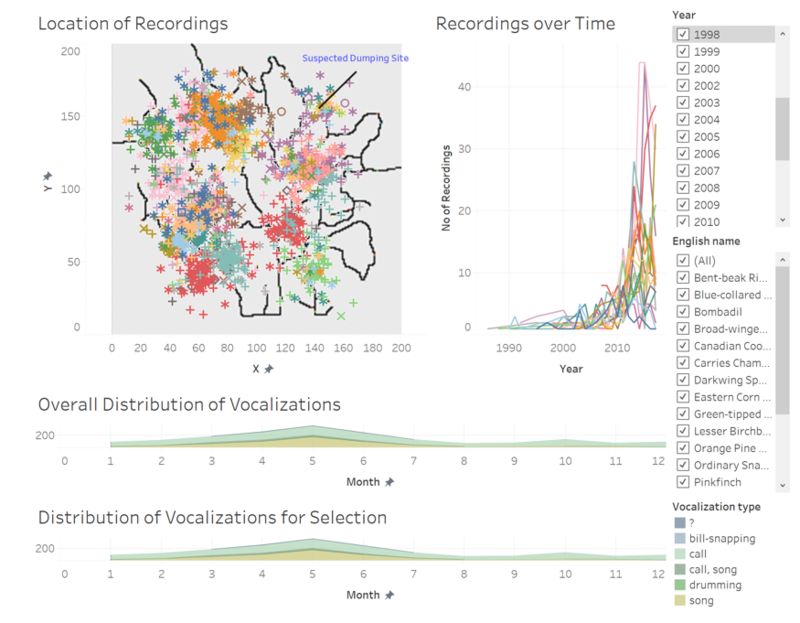
A Tableau dashboard is created for interactive analysis, which consists of the following components.
- Graph 1: Line graph that represents the number for bird recordings for each species across years.
- Filters: Species only.
- Graph 2: Locations of bird recordings mapped on to Lekagul Roadways graph.
- Filters: Species, Year
- Graph 3: Distribution of vocalization types of the recordings across months.
- Filters: Species only. This graph does not respond to selections in terms of years. It is meant to be a summary across years which can be used to compare against Graph 4.
- Graph 4: Distribution of vocalization types of the recordings across months for years selected.
- Filters: Species, Year
Insights from Exploration
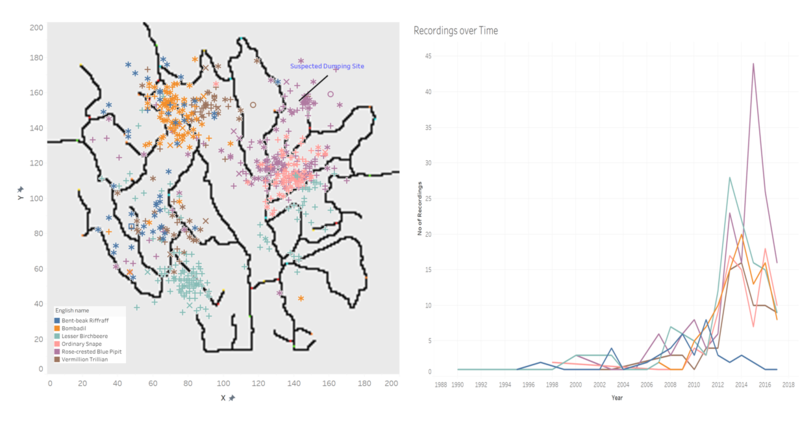
- From the line graph it is evident that there are few species for which recording counts have considerably dropped and for others it has not. Following are the species that intrigue viewer:
- Bent-beak Riffraff
- Bombadill
- Lesser Birchbee
- Ordinary Snape
- Rose-crested Blue Pipit
- Vermillion Trillian
- These are also the species that are clustered nearer to the alleged dumping site. There are recordings of other species around the dumping area but are few in number.
- Lesser Birchbee cluster is farer from the alleged site and the onset for downfall seems to have come earlier for this species. For Ordinary Snape, which is clustered between the alleged site and Lesser Birchbee there is no significant downtrend.
- The distribution of Vocalization types for species seems to have differences from the original distribution and has to be investigated deeper. Also, graph3 which is used as a baseline for comparing graph4 is a summary of records consisting of instances before and after the alleged dumping and hence will not be insightful.
Hypothesis
- Decrease in recordings imply decrease in population counts and could be caused as an aftereffect to the alleged dumping.
- All bird species residing in the alleged area might be effected more or less equally by the incident and hence the area effected can be determined based on the damage.
- Birds Vocalizations hold meaning and calls are often related to communicating where-about, warnings, begging pleas and driving away enemies. Songs are most commonly associated with seduction and proclaiming dominance. Having said that, few species sing often than others.
Link to Dashboard:
https://public.tableau.com/profile/amrutha.rajeshwari8389#!/vizhome/VAST-LekagulRecordingsDashboard/AllbirdsTrendsanddistribution


