Difference between revisions of "ISSS608 2016-17 T3 Assign ONG GUAN JIE JASON Data Visualization"
Jump to navigation
Jump to search
| Line 33: | Line 33: | ||
<br/> | <br/> | ||
| − | <font size="5">'''Data | + | <font size="5">'''Data Visualization'''</font> |
| − | + | This is a brief description of the features of the interactive visualization that is implemented for this assignment. | |
| − | = | + | =Home Dashboard= |
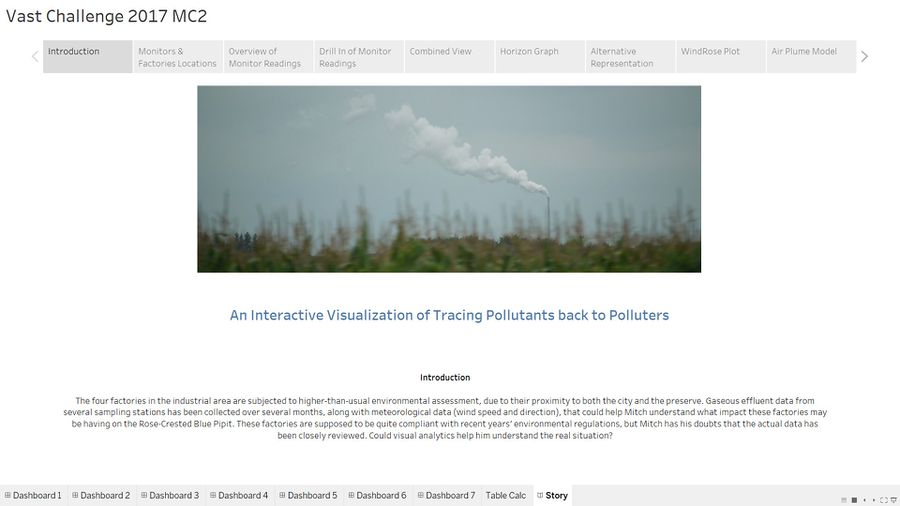
| + | The homepage provides a brief overview of the assignment. | ||
| + | [[File:JO_V1.jpg|900px|center|border]] | ||
| − | == | + | =Monitors & Factories Location= |
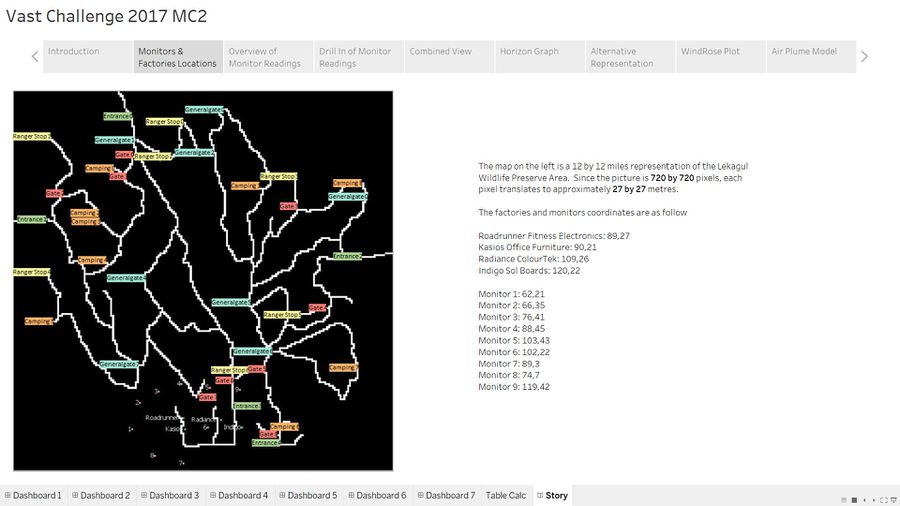
| + | The map of the place of interest is featured here alongside with the coordinates of the factories and monitors. | ||
| + | [[File:JO_V2.jpg|900px|center|border]] | ||
| + | |||
| + | |||
| + | =Overview of Monitor Readings= | ||
| + | |||
| + | |||
| + | =Drill in of Monitor Readings= | ||
| + | |||
| + | |||
| + | =Combined View= | ||
| + | |||
| + | |||
| + | =Horizon Graph= | ||
| + | |||
| + | |||
| + | =Alternative Representation= | ||
| + | |||
| + | |||
| + | =windRose Plot= | ||
| + | |||
| + | |||
| + | =Air Plume Model= | ||
Revision as of 12:24, 11 July 2017
 ISSS608 Assignment 2 Ong Guan Jie Jason
|
|
|
|
|
|
|
Data Visualization
This is a brief description of the features of the interactive visualization that is implemented for this assignment.
Contents
Home Dashboard
The homepage provides a brief overview of the assignment.

Monitors & Factories Location
The map of the place of interest is featured here alongside with the coordinates of the factories and monitors.
