ISSS608 2016-17 T1 Assign3 Ong Han Ying - Homework Answer
| CRIME SCENE DO NOT CROSS....................CRIME SCENE DO NOT CROSS....................CRIME SCENE DO NOT CROSS....................CRIME SCENE DO NOT CROSS |
Contents
- 1 About
- 2 Question 1
- 3 Question 2
- 3.1 Image 1A & B: Communication Pattern to the Helpdesk
- 3.2 Image 2: Communication of Guests - Opening and Closing Hours of DinoFun World
- 3.3 Image 3: Communication After 23:30 on Saturday
- 3.4 Image 4: Overview of Communication by Locations
- 3.5 Image 5: High communication frequency at Coaster Alley at 11AM for all 3 days
- 3.6 Image 6: High communication frequency at Coaster Alley at 4PM For Fri & Sat only
- 3.7 Image 7: A Spike Increase in Communication at Kiddieland - Saturday at 5PM
- 3.8 Image 8: Communication at Wetland - The Entrance to the Crime Scene
- 3.9 Image 9: Communication exchange at 1129 to 1139 on Sunday, at Wetland - Outdegree
- 3.10 Image 10: Communication exchange at 1129 to 1139 on Sunday, at Wetland - Indegree
- 4 Question 3
About
This page is dedicated to answer to the assignment question directly.
The assignment has been designed in an excitment way that depicts how the detective, Dino Holmes cracked this case. However, the author understands that the images (solutio to the question) has not been organized in a way that is easy for the instructor to follow, in marking.
Hence, this page is created to help to re-organize the images, and input in those images that answeer to the Assignment's questions' directly.
Question 1
Identify those IDs that stand out for their large volumes of communication. For each of these IDs Characterize the communication patterns you see. Based on these patterns, what do you hypothesize about these IDs? Note: Please limit your response to no more than 4 images and 300 words.
Images can be found in ACT 2 of the Story
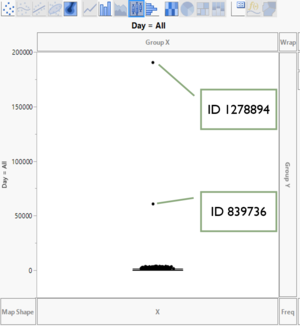
Image 1: Answer #1 2 Distinct IDS!
A boxplot reveals the following:
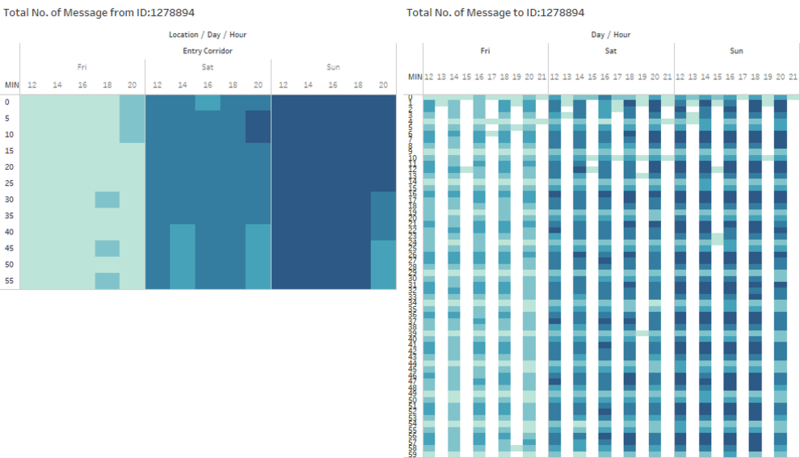
Image 2: ID 1278894
The top in the list is ID 1278894, and he/her communication pattern as below;
Rationale
- From the heatmap, we can see that ID1278894 sends out a message every 5 min regularly, in equal interval of every 2hour, between 1200 to 2000.
- Further analysis, this ID only send out from entry corridor, and it never move at all.
- This should be from the server, and likely the application of DinoFun World.
- Look like there are most people came on Sunday.
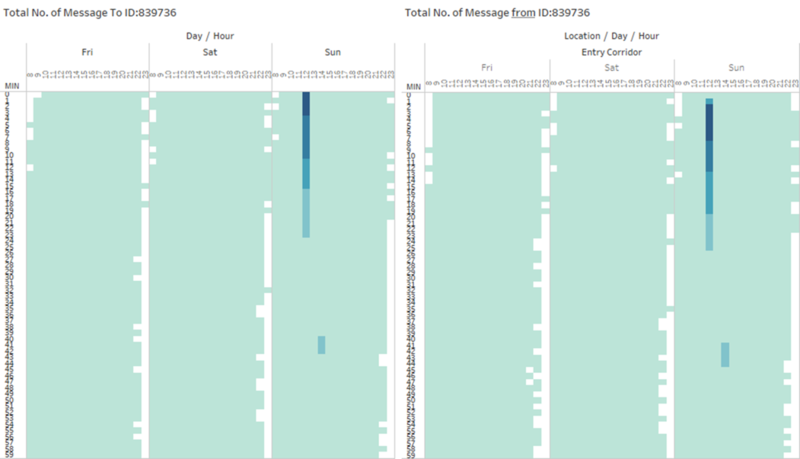
Image 3: ID 839736
Rationale
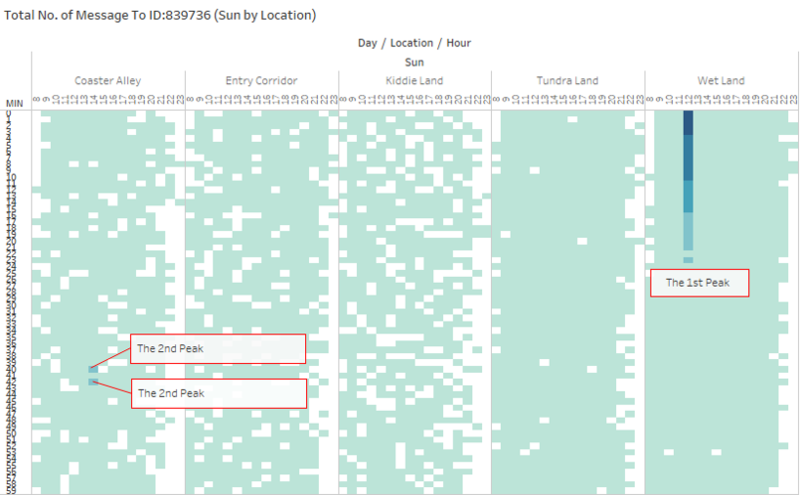
- From the heatmap, we can see that ID839736 received messages between 0800 to 2330, there are messages every minute.
- Further analysis, this ID only send out from entry corridor, and it never move at all.
- This should be from service helpdesk!
Question 2
Describe up to 10 communications patterns in the data. Characterize who is communicating, with whom, when and where. If you have more than 10 patterns to report, please prioritize those patterns that are most likely to relate to the crime. Note: Please limit your response to no more than 10 images and 1000 words.
Note: Image 1 to 7 can be found in ACT 2 of the Story. Image 8 to 10 can be found in ACT 4 of the Story.
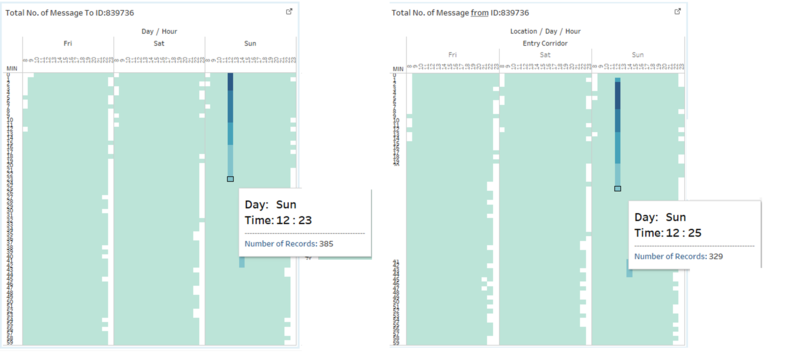
Image 1A & B: Communication Pattern to the Helpdesk
1. Communication pattern has been revealed in this image (to and from the helpdesk such that)
- The helpdesk is receiving the most number of messages between 1200 to 1223.
- It responds readily between 1201 to 1225.
- Communication happens mainly at Wetland (Image 1B)
Image 2: Communication of Guests - Opening and Closing Hours of DinoFun World
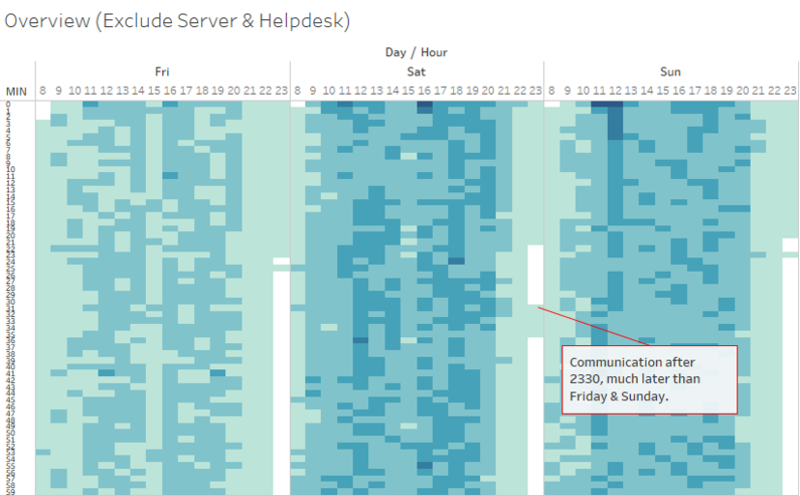
Based on Image 2;
it is likely that the themepark may open at around 8AM, and closed about 1130PM, since
- Communication among the Guests starts around 08:00.
- On Friday & Sunday, last communication ends before 23:30.
- Thus, communication after 23:30 on Saturday may not be a norm, and hence; its communication pattern is being analyzed.
- The distribution of the messages sent over time (image 2, excluding server & helpdesk, as below;
Image 3: Communication After 23:30 on Saturday
- As mentioned above, there is unusual high communication after 2330, on Saturday.
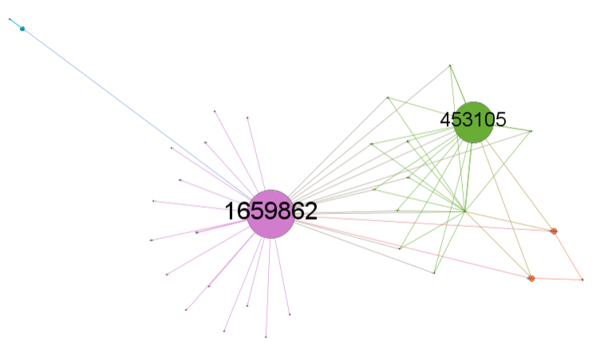
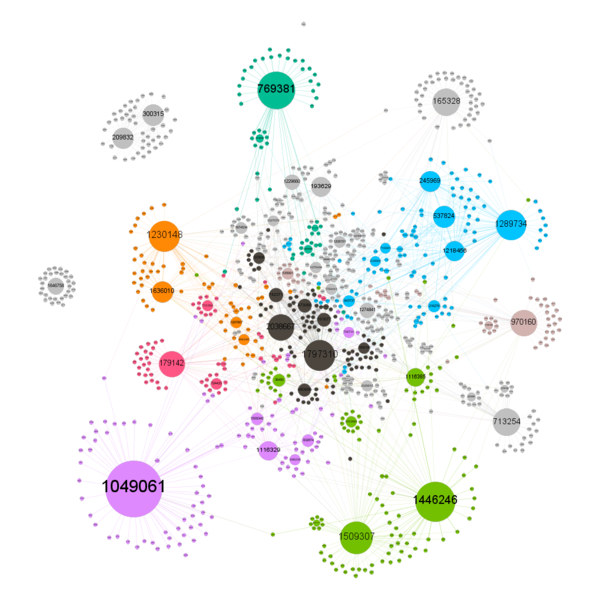
- Further investigation is required, and thus, the network graph (image 3) is used, as below;
- From the graph, we can see that there are 2 main coordinators among those who communicate during this specified timing.
- It might be a tour group that stayed late.
- There is also a communication to external. (We shall not make any wild guess first)
- We will take note of this, and find out if anyone that doesn't belong to the group, but still in the park.
Image 4: Overview of Communication by Locations
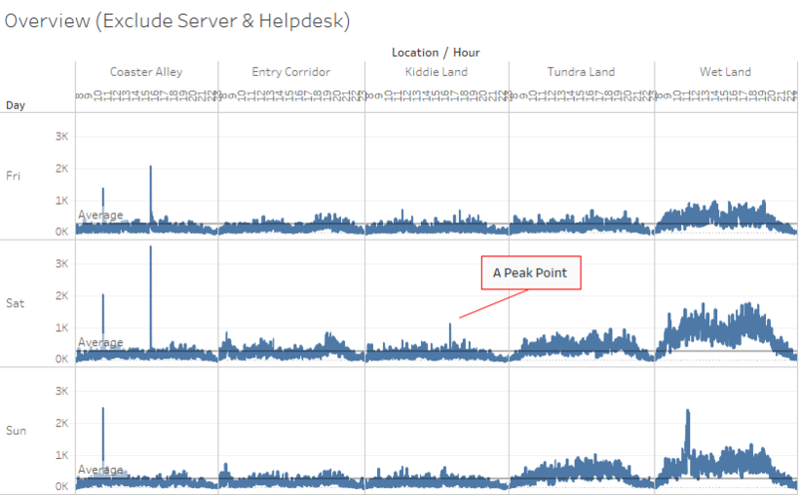
Image 4 is used as an overview for the subsequent analysis;
The distribution of the messages sent over time by venue, as below;
- There is a common peak at 11AM at Coaster Alley over 3 days, and 4PM at coaster Alley on Friday & Saturday.
- There is a significant higher spike at 1700, over at Kiddie Land.
Image 5: High communication frequency at Coaster Alley at 11AM for all 3 days
This is make up of 4 sub-images, so as to show the daily communication at 11AM - over the 3 days.
Outdegree is chosen to display as the node as it is able to display the tour group (or cluster of tourists) easier, as compared to others.
| Friday - Outdegree |
|---|
| Saturday - Outdegree | Sunday - Outdegree |
|---|---|
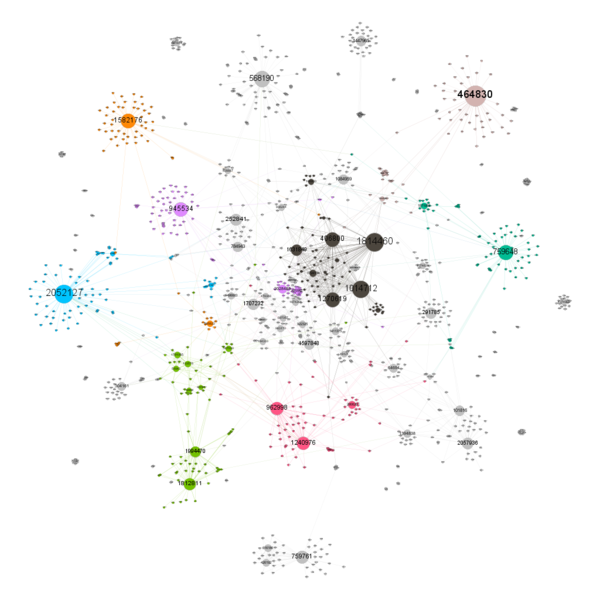
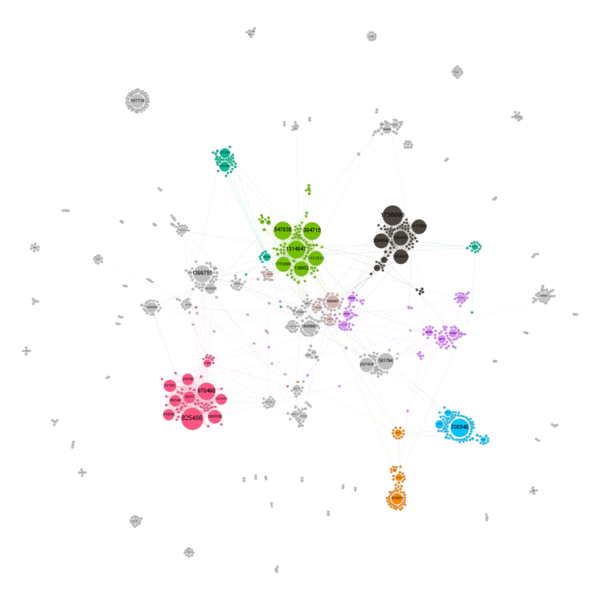
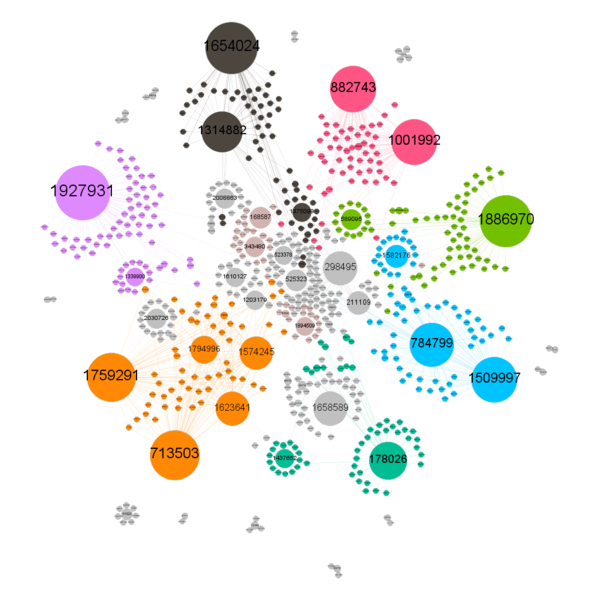
- Based on the out-degree network diagram, we are able to see that people are communication in groups, with certain ID (bigger node), sending out more messages to the others over the 3 days.
- These people are likely to be the leader of the group (or a tour guide).
- Also, we can see small clusters of group on their own, which might be groups of friends coming together.
- With this, with this high frequency of messages exchange, this is likely to be the showtime of Scott Jones (likely the end time, where people try to communicate to meet again etc), since it draws a large number of crowd and groups.
Image 6: High communication frequency at Coaster Alley at 4PM For Fri & Sat only
| Out Degree- Friday | Out Degree- Saturday |
|---|---|
For communication at 4PM, "out-degree" is selected because it is able to display the group more obviously, as compared to "betweeness" that show distinct group only. This is especially so when there seem to be many small clusters of group communication at this hour.
- It was clear that on both days, big group are attached, and therefore; there were communication among the people.
- The peak of the timing seems to suggest the showtime (either start or end time) of the 6 shows.
- Without a peak on Sunday at similar timing, it is likely that the "event" was "cancelled" or was not being organized, since there are supposed to be 6 shows.
Image 7: A Spike Increase in Communication at Kiddieland - Saturday at 5PM
- As above, we can see that the communication is made up of tour groups, too; based on the out-degree diagram.
- However, this is the only timeslot over the 3 days that has a spike, therefore; there might be some special events that occurs.
- This is especially fishy when this area is not near the performance & exhibition, and also; likely after the timing of the event of Scott Jones.
- Currently, we are unable to conclude if this were related to the crime, but the sudden increase in crowd in a place further away from the crime scene, can be fishy.
- Nevertheless, this image is useful to further analysis as in the event that the sudden in crowd is related to the crime, then; we are able to identify non-suspects -via the tour groups/ communication groups.
- Thus, this is worth to be taken note of, and to be analyzed further with the movement data.
Image 8: Communication at Wetland - The Entrance to the Crime Scene
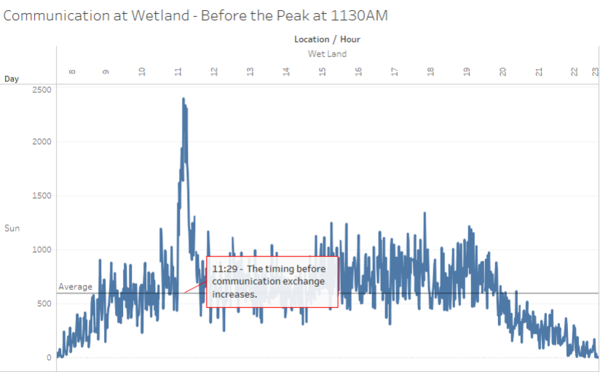
Since the entrance to the pavilion is located at the Wetland, we will analyze the communication volume in this area. It was revealed that,
- There is a peak of communication at around 11:30, as per the line graph. Hence, we should analyze the communication exchange of the people at this area.
- This will be shown in Image 9;
Image 9: Communication exchange at 1129 to 1139 on Sunday, at Wetland - Outdegree
Since wetland is the entrance to the pavilion, the crime scene, and image 9 has shown that there is a communication increase during this timing, we shall; analyzing the crowd in this area.
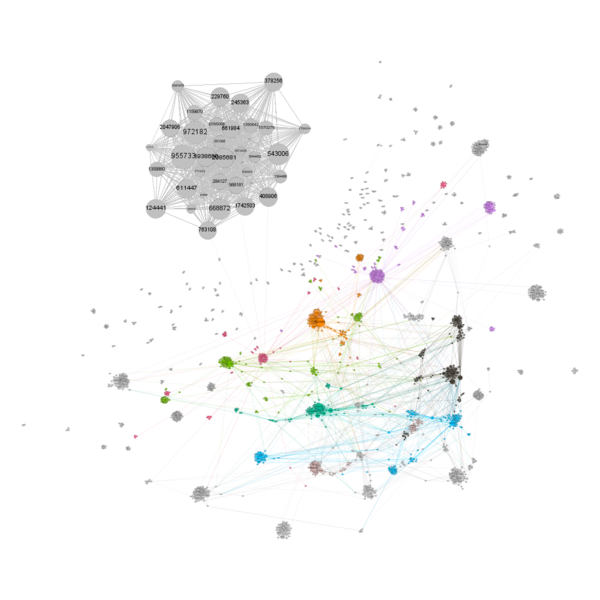
The out-degree diagram as shown below;
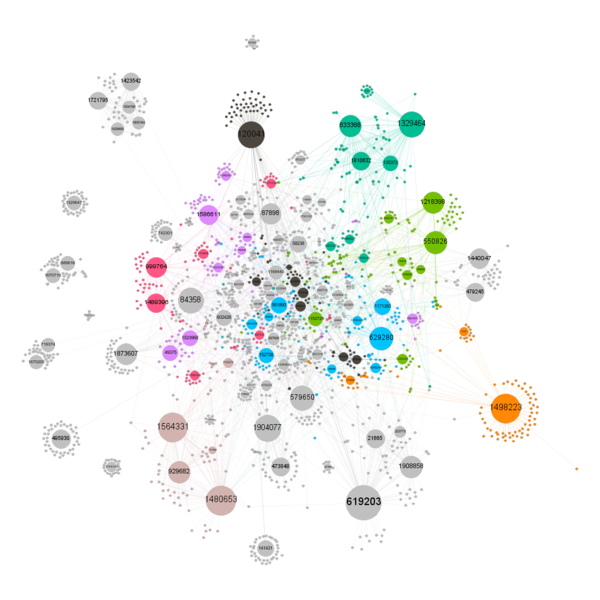
- It was interesting to note that there is a big crowd of people communication (sending out messages), and not directly communicating with the mass in the region.
- This may be the time when the vandalism was discovered, and the grey node, are those that are communicating this to the others.
Image 10: Communication exchange at 1129 to 1139 on Sunday, at Wetland - Indegree
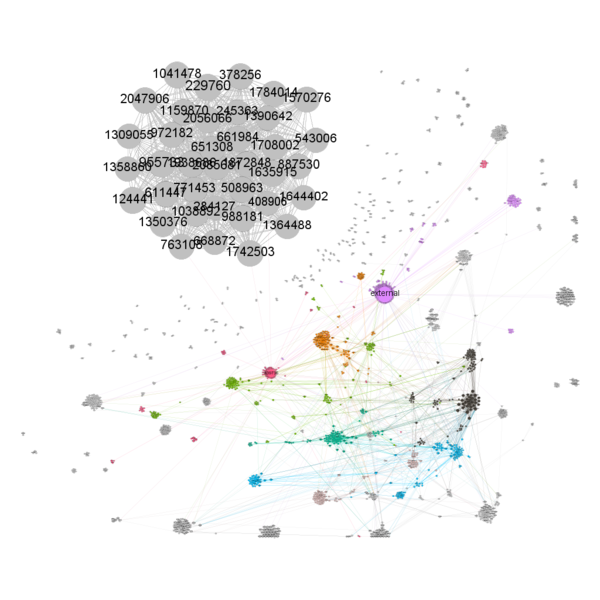
- Since we suspect that 11.29 to 11.39 is where the crime was discovered, we then further analyze by looking into the in-degree.
- Here, we can see a big bulk of in-message to the external parties (purple). Thus, it might be guests sharing the news to their friends outside, since this is a "significant news".
Question 3
From this data, can you hypothesize when the vandalism was discovered? Describe your rationale. Note: Please limit your response to no more than 3 images and 300 words.'
This question will be answered with related into the images above in question 2. The images chosen are; image 5, 6, and 9.
- Image 5 shows that 11AM might be the timing of the show (or the end of the show), as per the peak in all the 3 days. Also, big tour groups communicating in the area.
- Image 6 shows that there is a crowd also at around 4PM in the same place. Thus, confirming that 4PM is the slot of the show. Since this did not occur on Sunday, hence; it can be suggested that the show at 4pm of sunday is cancelled. This also suggests that the crime happen before SHOW 2 on sunday.
- Image 9 shows that there is a high frequency of communication at wetland, between 1129 to 1139. Also, there is a distinct group of communication, suggesting that there is indeed a large crowd (grey) communicating to the others. Hence, this suggests that they may have discovered the crime, and therefore; sharing with the others.
Changes After 2359 of 28 Oct 2016
- Update the links on the Control Panel.
- Added in Image 1B, to support the location of the communication.

