ISSS608 2016-17 T1 Assign3 Ong Han Ying - Behind The Scene
| CRIME SCENE DO NOT CROSS....................CRIME SCENE DO NOT CROSS....................CRIME SCENE DO NOT CROSS....................CRIME SCENE DO NOT CROSS |
Act#1
Fun Facts #01
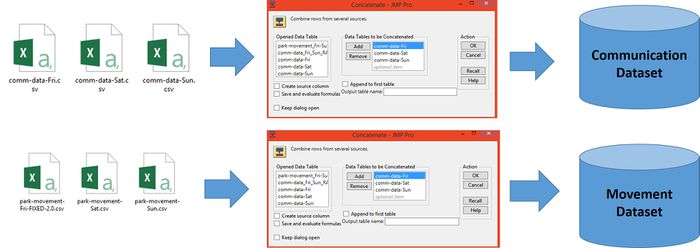
Question: How do we convert 6 data files into 2 files only?
Answer:
We Concatenate Friday, Saturday & Sunday Data into a Single Table for each, using JMP
Fun Facts #02
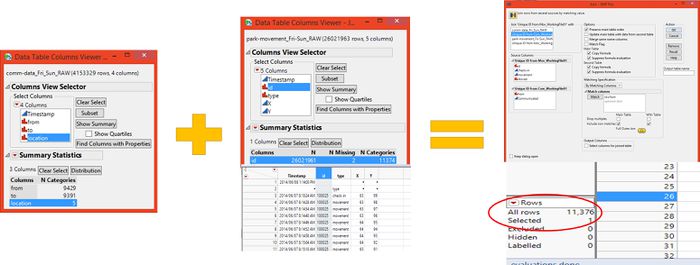
Question: How do you get the total number of suspects?
Answer: We combined both file, and look at the number of unique count!
Fun Facts #03
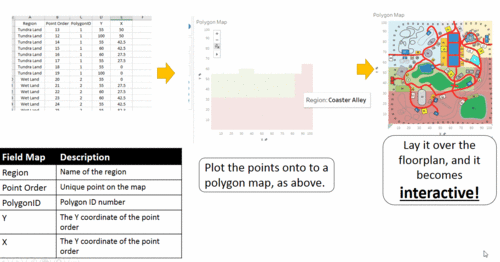
Question: How do you create the polygon map, based on an image?
Answer:
This is tedious! We identify the coordinate of each points of the regions, and add it on top of the image (floorplan).
Act#2
Fun Facts #01
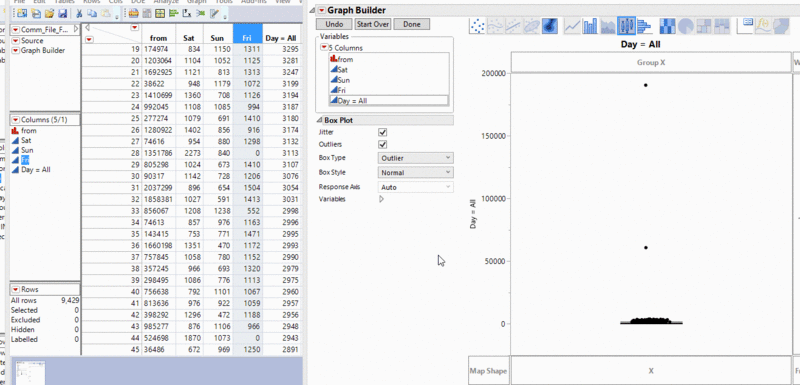
Question: How do you identify the outliers in JMP?
Answer:
- We study the outliers in the entire communication data (by total count per ID)
- We then found that there are a total of 313 outlier
- Based on the 313 outliers again, we did another test to identify the distinct outliers.
- We then identified that there are 2 distinct outliers.
The process as illustrated below; (Click to download the file, if it fail to move.)
Fun Facts #02
Question: For Answer #4A: Communication between 2330-2335 on Saturday. How do you create the graph? And why "betweeness" is selected?" Answer:
- The layout tried include (1) YiFan Hu, and (2) Fruchterman Reigold
- But we have selected the Forced Atlas 2 because it is able to prevent overlapping of the node, allowing us to have a better analysis.
- "Betweeness" is selected because it displayed the "coordinator" of the "gang", since it is likely a delay of a tour group. Hence, whoever, that is not with the tour-guide later, can become a suspect.
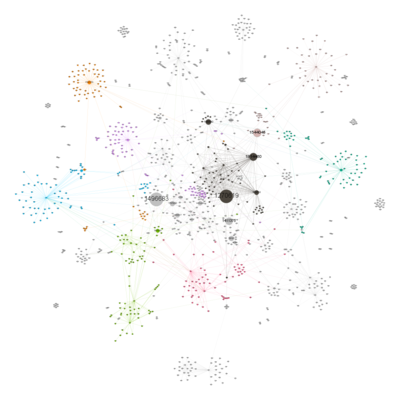
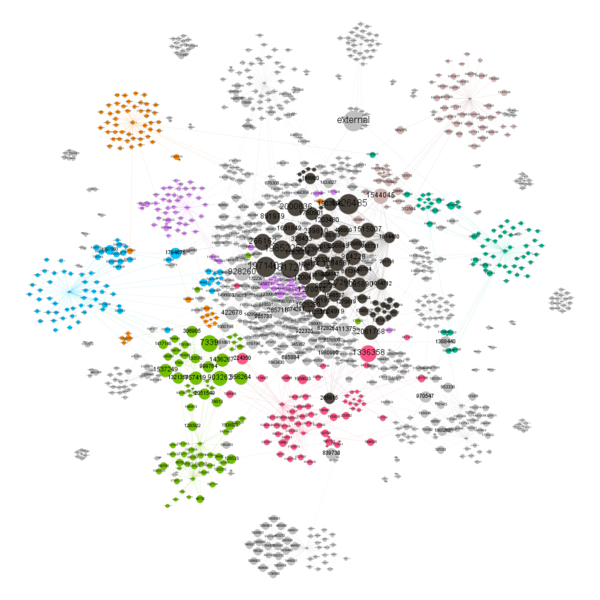
The various graphs generated, but not selected, as below;
Fun Facts #03
Question: For Answer #4B High communication frequency at Coaster Alley at 11AM for all 3 days And why "Out-degree" is selected?" Answer:
- We need to know who are the people (likely the leader) whom send out the mass message, and then; identify them as non-suspect later on (after comparing with their movement)
- The layout tried include (1) YiFan Hu, and (2) Fruchterman Reigold
- But we have selected the Forced Atlas 2 because it is able to prevent overlapping of the node, allowing us to have a better analysis.
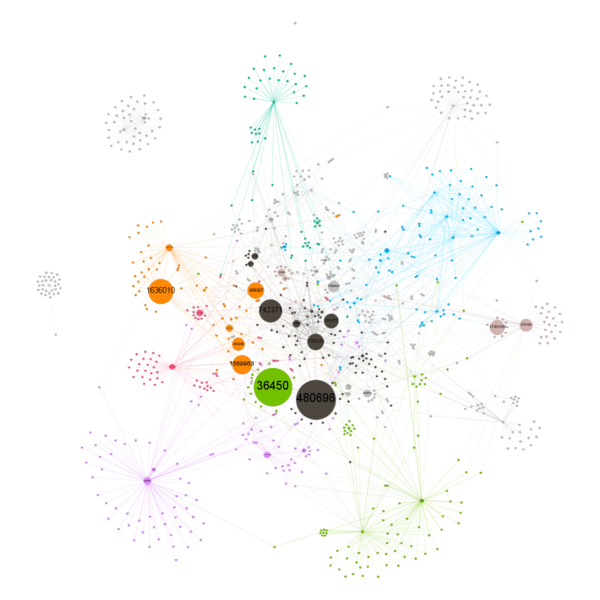
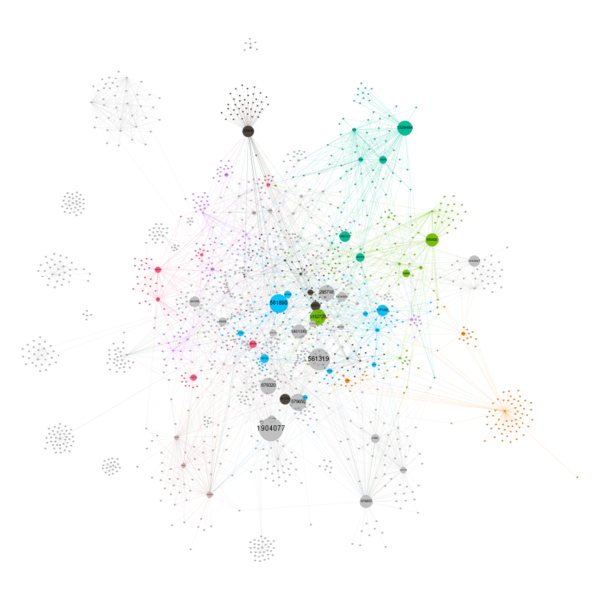
The various graphs generated, but not selected, as below;
| Friday - Betweeness | Saturday - Betweeness |
|---|---|
| Similar Node identified as "out-degree". But out-degree shows a clearer results. | Similar Node identified as "out-degree". But out-degree shows a clearer results. |
| Saturday - In-Degree | Sunday - In-Degree |
|---|---|
| Similar Node identified as "out-degree". But out-degree shows a clearer results. | Similar Node identified as "out-degree". But out-degree shows a clearer results. |
| Sunday - Betweeness |
|---|
| Similar Node identified as "out-degree". But out-degree shows a clearer results. |
Fun Facts #04
Question: For Answer #4C High communication frequency at Coaster Alley at 4PM For Fri & Sat only" Answer:
- We need to know who are the people (likely the leader) whom send out the mass message, and then; identify them as non-suspect later on (after comparing with their movement)
- The layout tried include (1) YiFan Hu, and (2) Fruchterman Reigold
- But we have selected the Forced Atlas 2 because it is able to prevent overlapping of the node, allowing us to have a better analysis.
| Betweeness- Friday | Betweeness- Saturday |
|---|---|
Act#3
Fun Facts #01
Question: How did Dino Holmes know the operating hour of DinoFun World, via the Data?
Answer:
- Using JMP, we created a cross table using the Movement Data;
- We identify the min of the time-stamp
- we then followed by identifying the max of the time-stamp
- its that easy!
Fun Facts #02
Question: How did Dino Holmes know the traffics of the Pavilion, and the Stage?
Answer:
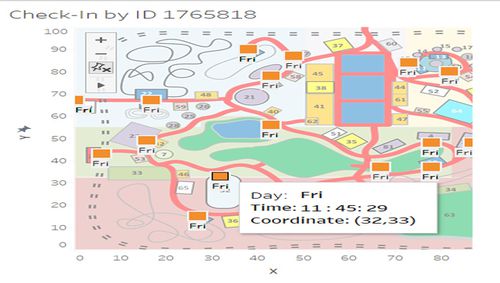
- Well, Dino assume that the coordinate of the location ,
- and count the total number of check-ins!
- You may ask - how to get the coordinate? ASK TABLEAU, as below; (Using any ID that check into the park)
Fun Facts #03
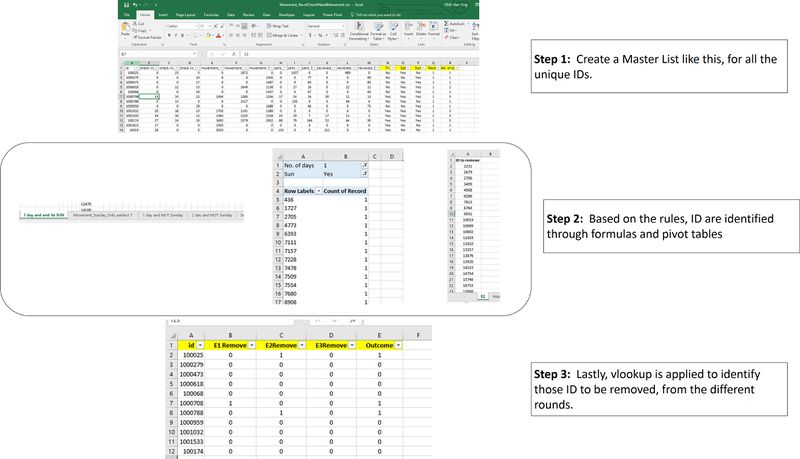
Question: How did Dino Holmes identify the IDs to be removed?
Answer:
- It is done manually!
- Using JMP to filter and join the tables, Dino create a master data, that have aggregated the frequency of the attendnace for each day.
- based on the elimination rule, Dino identify each of the ID that meet the rule, and identify them
- in the last step, Dino identify those that did not fit into any of the rules at all.
An overview of the steps, as below;
Act#4
Fun Facts #01
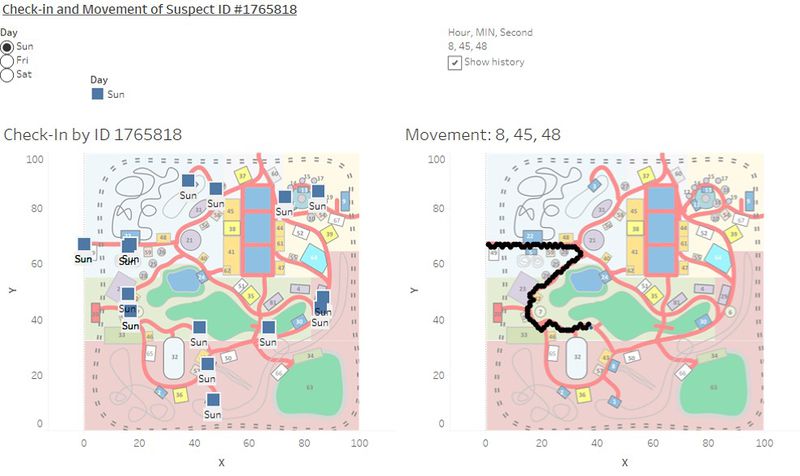
Question: How did Dino Holmes track the movement of #ID1765818?
Answer:
- Dino Holmes do so using a dashboard, via the movement data.
- You can play with the dashboard too, by CLICKING HERE : Movement of ID #1765818 on Tableau
A snapslot as below;
Act#4
Fun Facts #02
Question: There are strong assumptions made here! WHY!!!
Answer:
1. Assumption has to be made at this point of view that the suspects are being tracked with either movement/check-in during the crime period & zone because;
- Insufficient data provided;
- While it may be true that the culprit can leave no trace behind, with no movement/check-up and perhaps with communication only - but this is not possible because;
- If the culprit is able to hide its movement through technology, then; he/she should be wiser enough to hide the communication instead!
- Hence, this assumption is not possible.
2.If the culprit is able to hide "mess" he/her movement through technology, and hide the communication,
- While this is possible, however; we have to assume that at some point of time;the data is being tracked correctly (even if it were just a movement) because
- if the data were entirely wrong, then; any possibilities will have to be made up based on "imagination", instead of being "data-driven". This is against the spirit of this story; which is to share more on how visual analytics can be use to solve a crime.
3. When the case has been reduced such that it has become "binary" - for instance; where
- the culprit has to be identified by movement / check-in during the point of crime as without either one of them;
- having communication data alone is unable to help us to identify the culphit because it only provide the information of region, but give no information on entering the crime zone.

