AY1516 T2 Inpatient Meals Survey ProjectOverview Methodology

| Project Description | Data | Methodology |
|---|
Current Method
MRC currently conducts these surveys using Qualtrics and then uses SPSS software to analyze the data. The main statistical measure used to analyze the data is the mean of the ratings given for each attribute. They drill down to analyze the average rating by wards, dietary preferences, types of patients and other dimensions. However, as discussed before in the report, this method is flawed and does not provide the best results. This is primarily because the distance between the ratings are not measurable and cannot be interpreted.
The mean can fall in a decimal and a mean of say 3.4 or 3.6 is not telling much of the story that the client will want to read. What can one make of the data when the mean comes to a decimal point between 3 and 4? Say for example the mean is 3.4, the report would say that the patients are satisfied on an average, but then again this is a mean what if this mean arrived due to a lot of people rating 5 and just a lesser number than that rating 1. Is the analysis correct then? No, because there are a lot of people who are not at all satisfied and their needs are overlooked.
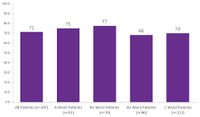
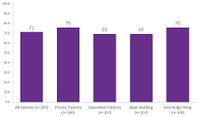
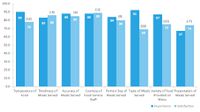
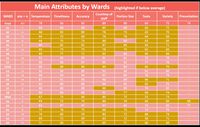
Different graphs are generated and then insights are collaborated. Below are some screenshots of the analysis done by MRC on the survey data for October 2015 and November 2015.


New Method