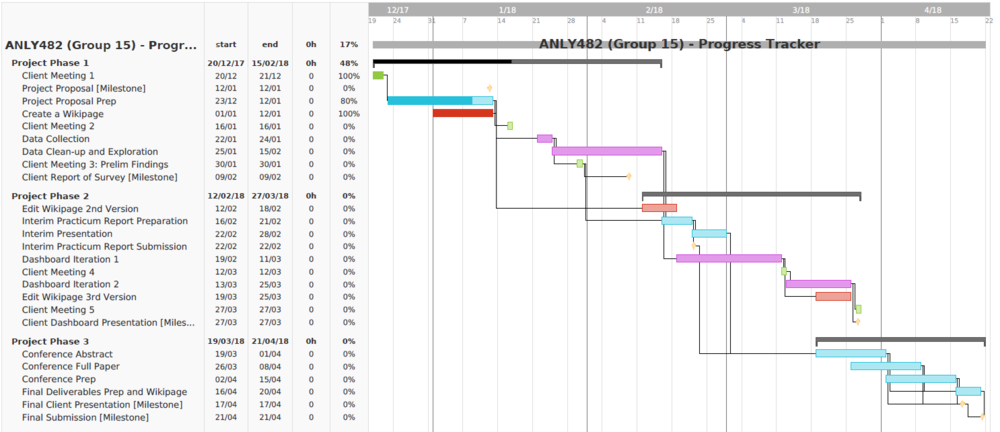
ANLY482 AY2017-18 T2 Group15 Final Project Overview
Revision as of 22:20, 10 April 2018 by Amanda.lim.2014 (talk | contribs) (Created page with " <font face="Helvetica"> {| style="background-color:#FFFFFF; color:#ffcc16 padding: 5px 0 0 0;" width="100%" cellspacing="0" cellpadding="0" valign="top" border="0" | | style...")
OUR MOTIVATIONS
- Data visualization is an important tool in driving success in businesses. Because of the way our brains process information, certain methods of data presentation, such as clear charts and graphs, make it much easier to convey important information and concepts to an audience, as compared to spreadsheets and reports.
- This is especially important for large companies, which have access to large amounts of data, as their data may hold crucial information on the business and the market. By adopting standardised processes of data cleaning, structuring and transformation, businesses can create visualisations which improve business decisions and efficiency.
METHODOLOGY
- Our project methodology will consist of, but is not limited to, the following:
- 1. Correlation Analysis
- Correlation Analysis will be done between Marketing Expenditure and Brand Equity Scores. This will show how a particular marketing action affects the sales of the various beverage brands.
- 2. Market Basket Analysis
- This is an analysis between how the sales of different brands correlate to each other. One of the main deliverables of interest will be the analytics of cannibalization effects among the brands.
- 3. Seasonality Trends
- We will analyze how sales fluctuate on a broader scale, such as during holiday months and seasons, as well as how marketing campaigns affect sales trends.
- The main tool to be utilised will be JMP Pro 13. This tool is selected for its combination of statistical analyses capabilities and visualization features provided. The end deliverable will be an interactive, updatable (through synchronisation) HTML dashboard that is accessible through mobile devices.
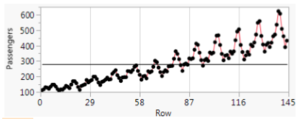
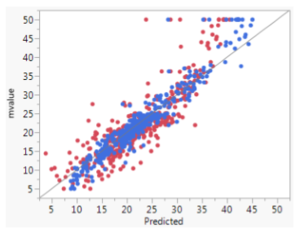
- Some examples of JMP functionalities that we may use is shown below.
| Visualization | Description |
|---|---|
|
|
This is a simple and easily understood visualization to display sales trends. Individual graphs could be used to visualize the sales trends for each product, or for each sales channel, etc. |
|
|
This plot provides analysis of model fit, taking into account variations due to random effects. After establishing the impact of marketing spending on sales, this visualization can help users discern the accuracy of sales predictions based on marketing spending by comparing the predictions against actual historical sales. |
SCOPE OF THE PROJECT
- We will be working with data of all beverage products sold by the company in Singapore. In terms of data, we will be working mainly with Marketing and Sales data as our primary focus is to link these two segments meaningfully.
DATA USED
- Company X provided us excel files containing the following data:
- Distribution of stores Company X supplies to across Singapore from 2014 to 2017, according to the type of store, the product brand supplied and the region the store is located. There are four types of stores, namely:
- THC: supermarkets, convenience stores and petrol marts.
- TOP: Chinese restaurants and seafood restaurants.
- MOB: modern cafés, bars and pubs.
- New channels and events: stores which are not permanent such as carnivals and sponsorships.
- Distribution of stores Company X supplies to across Singapore from 2014 to 2017, according to the type of store, the product brand supplied and the region the store is located. There are four types of stores, namely:
- Key performance indicators of each brand from 2014 to 2017 for different age groups of males. The KPI scores are derived from surveys conducted by Company X.
- Price index of each brand from 2015 to 2017. This shows the average retail prices.
- Details of the promotions which retailers advertised on newspapers such as The Strait Times and Lian He Zao Bao, from 2017 to 2018, for the brands Company X owns as well as competing brands.
- Duration and date of the campaigns Company X held for each brand in 2017.
- Monthly sales volume for each brand from 2014 to 2017.


