ANLY482 AY2017-18T2 Group30 Youtube
| HOME | ABOUT US | PROJECT OVERVIEW | EDA | BUSINESS OBJECTIVES | PROJECT MANAGEMENT | DOCUMENTATION | MAIN PAGE |
| Facebook Post | Facebook Video | Youtube | Blog Post |
|---|
For data files from YouTube(Watch Time), the sponsor provided exported data for Watch Time, with different metric tabs in Excel format. The tabs included are:
- Video
- Geography
- Date
- Subscription Status
- Youtube Product
- Device Type
- Subtitles and CC
- Video Information Language
For data files from YouTube(Demographics), the sponsor provided exported data for watch time for different Demographic, with different metric tabs in Excel format. The tabs included are:
- Viewer Age
- Viewer Gender
For data files from YouTube(Traffic Sources), the sponsor provided exported data for watch time from different traffic source type
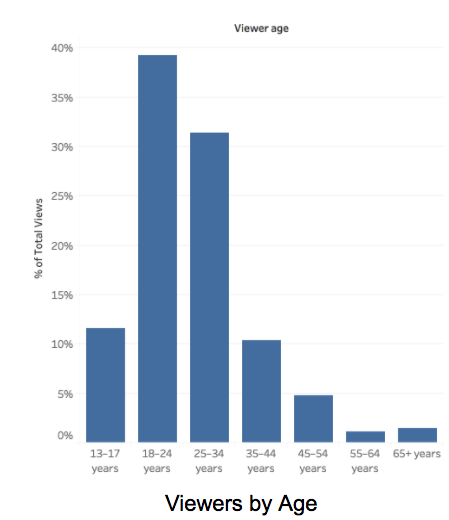
As seen in the chart below, majority of viewers (>70%) fall into the age category of 18-34. Slightly over 10% of viewers fall into the age categories of 13-17 and 35-44 each as well, with less than 5% of views who are above 54.
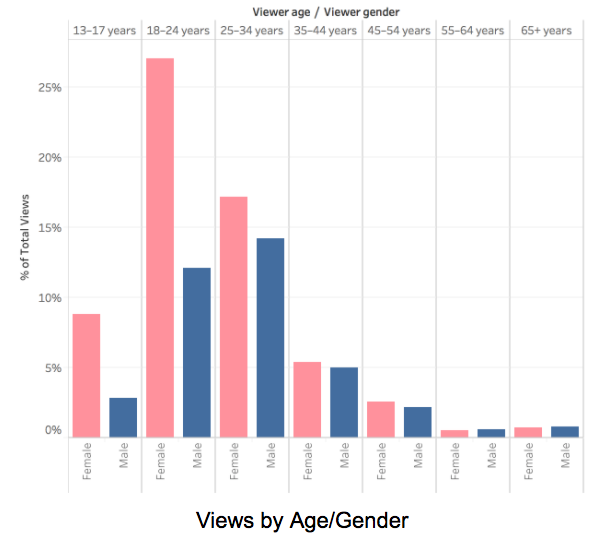
Across all the age groups, there is always a larger percentage of female audience except for those 35 and older. The disparity is especially obvious in the 18-24 category, with almost twice as many female viewers.
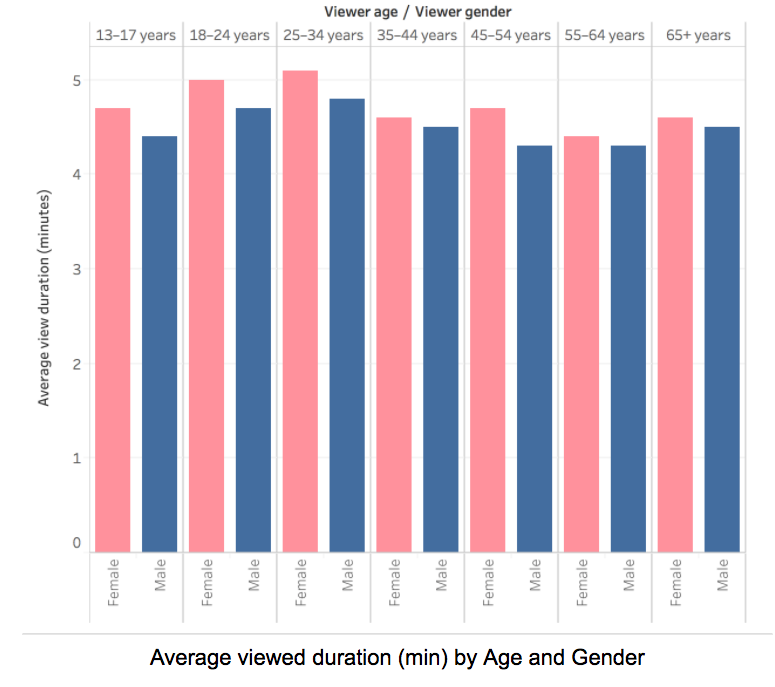
Despite differences in views for age and gender, there are no significant differences observed for the average duration (in minutes), which is around 4-5 minutes.
All of the above findings are consistent with that of Facebook Videos.


