ANLY482 AY2017-18T2 Group30 Instagram
| HOME | ABOUT US | PROJECT OVERVIEW | EDA | BUSINESS OBJECTIVES | PROJECT MANAGEMENT | DOCUMENTATION | MAIN PAGE |
| Facebook Post | Facebook Video | Youtube | Blog Post |
|---|
Data Source
To retrieve data from the company's instagram, we made use of a web-scraping script from Github. We made modifications to the script to include timestamp as well as caption, the data includes:
- Caption
- Timestamp
- Img URL
- Tags
- No. of Likes
- No. of Comments
Data Preparation
After scraping the data, we realised that the data needed cleaning. The indexes of the column values were off as seen here:
We also concatenated the "tags" into a single column.
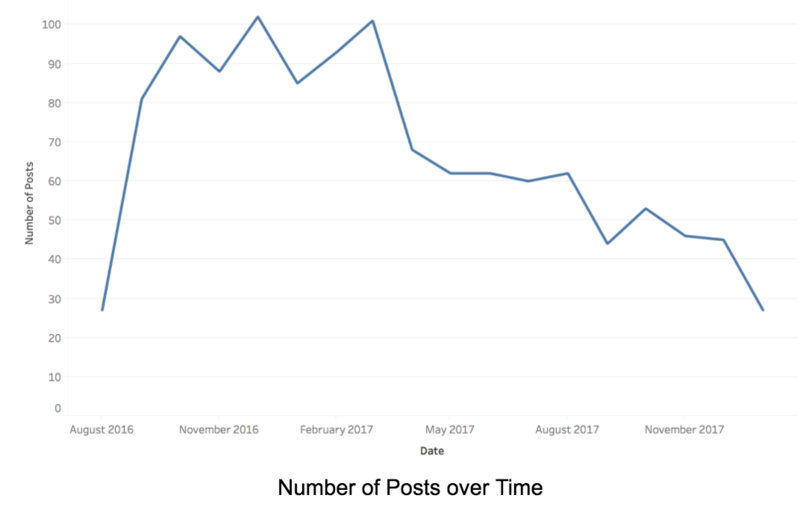
The dataset contains Instagram posts collected from August 1, 2016 to February 1, 2018. From the chart below, we can observe that this is a constant decline of number of posts over the time.
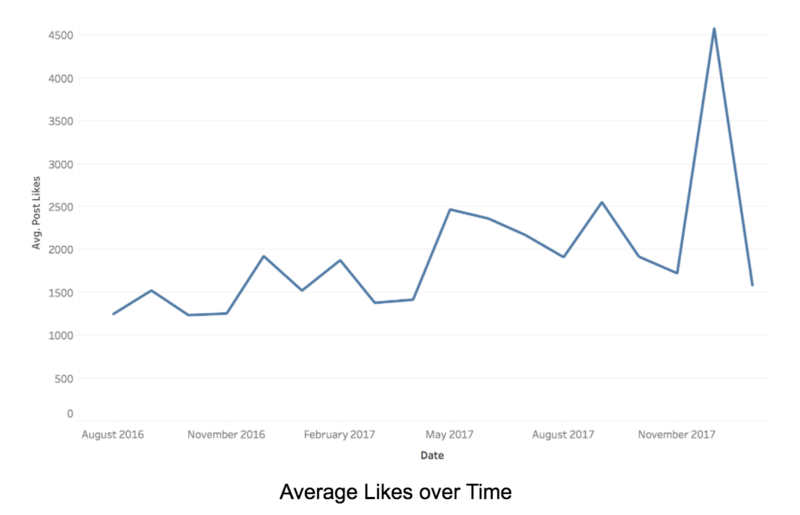
However, despite the decline in number of posts, there is a steady increase of average number of “Likes” over time. This can be possibly due to better quality of posts as opposed to quantity.
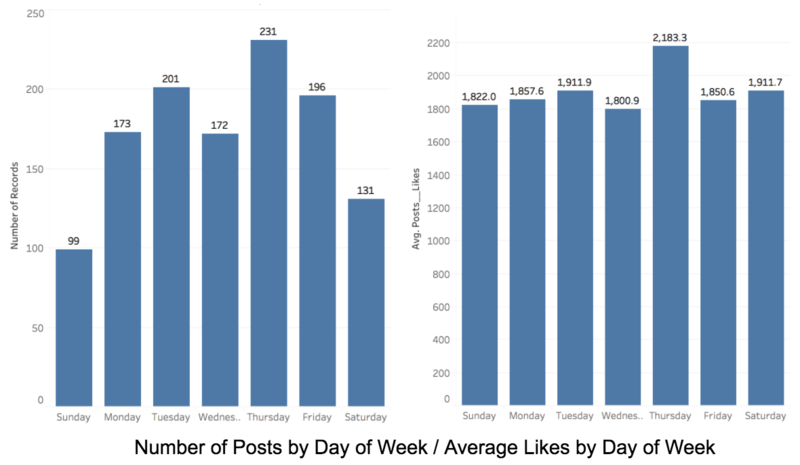
Analysing the number of posts by Day of the Week tells us that most content are posted on Thursday. There are a considerably less number of posts on the weekends -- which they can consider scheduling their posts on to garner more likes and reach out to more people. We can see that the average number of Likes are spread out quite evenly over the days, which means that more posts should be equally spread out over the days as well. However, the average number seems to be significantly higher on Thursdays.
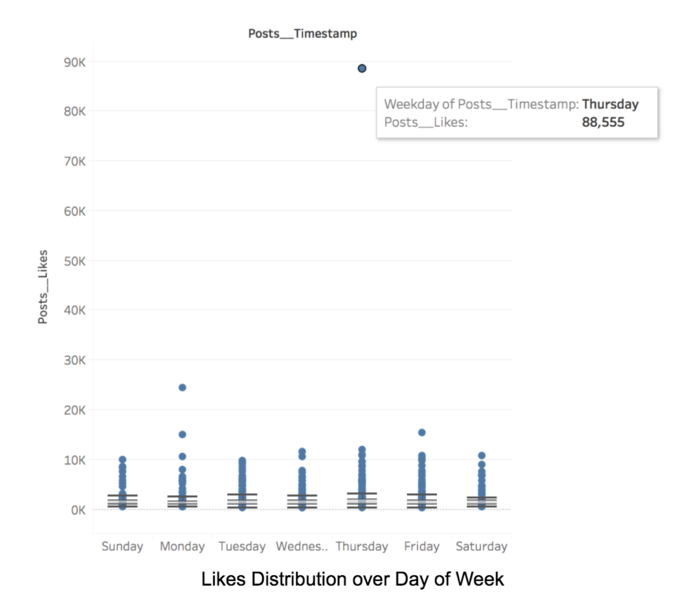
Further analyses shows that there is an outlier single post garnering over 80,000 likes which has skewed the average. As such we will be removing this data point for further analyses. Upon further investigation, we realised that this is not the number of “likes” for an image, but rather “views”. As Instagram recently added videos to post content, the data will contain videos as well, which cannot be distinguished from images using the current dataset. As such, we will have to make modifications to the crawler script to identify videos and add a metric for “views”.
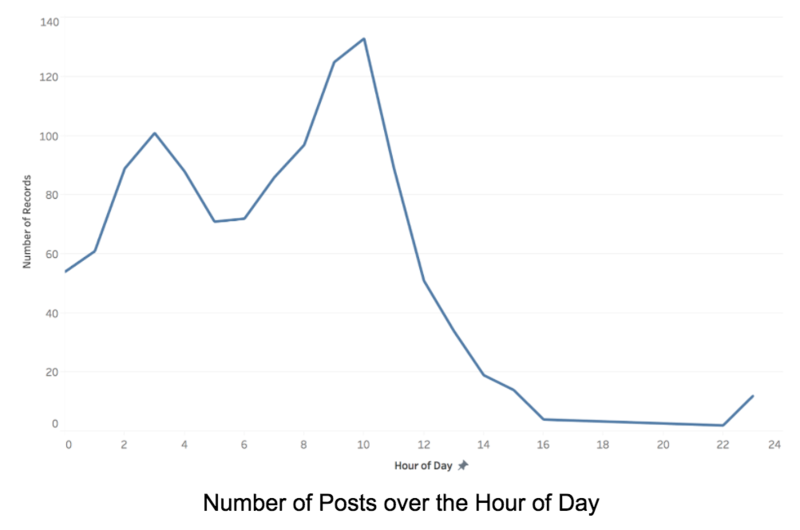
Similarly, we observe the number of posts by the Hour of the Day. Surprisingly, between 12pm to 12am, there are very few posts as compared to the other half of the day. With this, we would like to study if the time of posting affects the total number of likes and comments received.
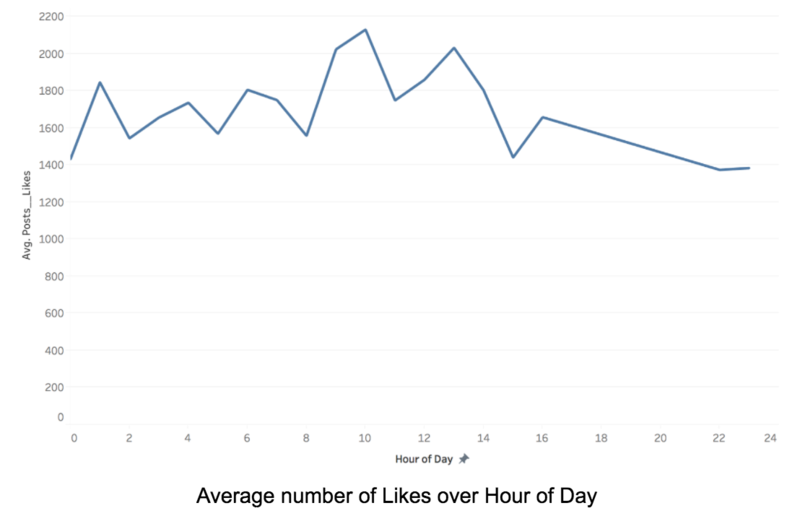
Looking at the Average number of Likes over the Hour of the day, there are not much significant differences. The slightly lower number of average likes from 12pm to 12am could be due to insufficient data points.
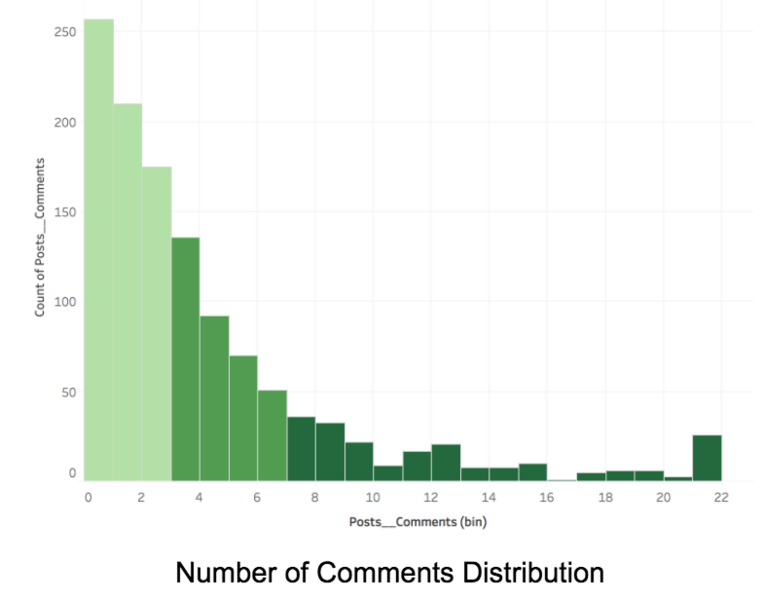
By plotting a histogram for the number of comments, we see a right skewed distribution. We see that most posts garner around 0-2 comments, with posts rarely having more than 7 comments. Using this data, we created an additional column to categorize the data: 0-2: Low Comments, 3-6: Medium Comments, 7 and Above: High Comments
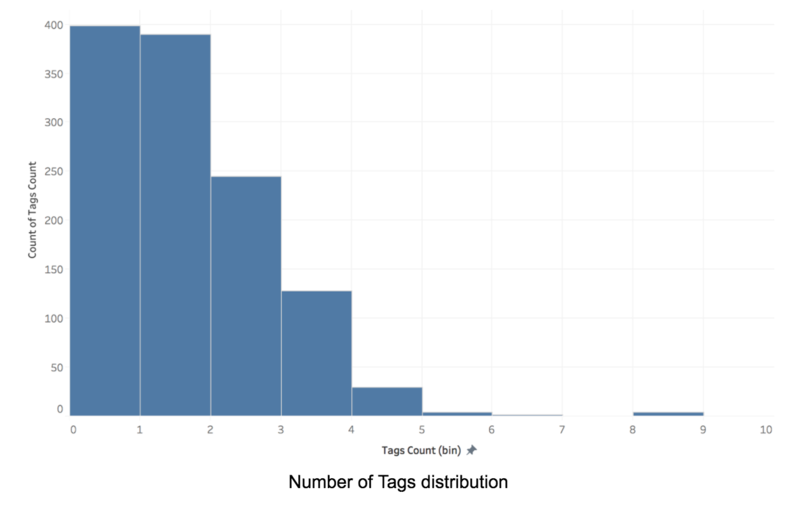
In addition we would also like to investigate if the number of tags in a posts would affect the performance. From the text columns of hashtags, we created a numeric variable which contains the number of tags a post has. The chart below shows a distribution of the number of tags, with most posts having tag counts of 0 - 3.
