ANLY482 AY2016-17 T2 Group11: Project Findings Final
| Interim | Final |
Paper 1 Final Slides | Final Practice Research Paper 1 | Paper 1 Poster
Paper 2 Final Slides | Final Practice Research Paper 2 | Paper 2 Poster
Paper 3 Final Slides | Final Practice Research Paper 3 | Paper 3 Poster
Contents
- 1 Paper 1: Using Latent Class Analysis to Standardise Scores from the PISA Global Education Survey to Determine Differences between Schools in Singapore
- 2 Paper 2: An Analysis of Singapore School Performance in the Programme for International Student Assessment (PISA) Global Education Survey
- 3 Paper 3: Using Partition Models to Identify Key Differences Between Top Performing and Poor Performing Students
Paper 1: Using Latent Class Analysis to Standardise Scores from the PISA Global Education Survey to Determine Differences between Schools in Singapore
Singapore’s Ministry of Education started a slogan, “every school a good school” in 2013. However, the public sentiment is that all students do not start on an equal footing.
OECD education director Andreas Schleicher mentioned that “Singapore managed to achieve excellence without wide differences between children from wealthy and disadvantaged families.
This begs the following questions: Is it fair to state that all schools are good schools?
Objective
Through our analysis, we seek to determine if there are differences between schools in Singapore based on their PISA performance .
Methodology
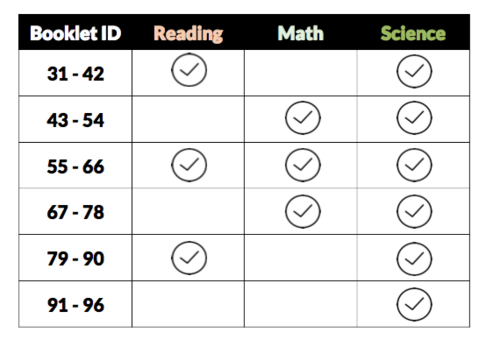
From the 2015 PISA data, there were 66 booklets use and each booklet contained different number of questions and a combination of science questions together with reading and/or math questions.
Latent class analysis (LCA) will be used to classify questions to their most likely latent classes (easy, medium, or hard).
Each question’s weight will be adjusted based on the LCA results to determine the standardized score of each student.
Literature Review
Latent Class Analysis
Latent class analysis (LCA) is a statistical method for finding subtypes of related cases (latent classes) from multivariate categorical data. The results of LCA can be used to classify cases to their most likely latent classes. Common areas for the use of LCA are in health research, marketing research, sociology, psychology, and education. This clustering algorithm offers several advantages over traditional clustering approaches such as K-means such as assigning a probability to the cluster membership for each data point instead of relying on the distances to biased cluster means and LCA provides various diagnostic information such as common statistics, Bayesian information criterion (BIC), and p-value to determine the number of clusters and the significance of the variables’ effects.
This method was applied on the 2012 PISA data of Taiwan to objectively classify students’ learning strategies to determine the optimal fitting latent class model of students’ performance on a learning strategy assessment and to explore the mathematical literacy of students who used various learning strategies. The findings of the research shows that a four class model was the optimal fit model of learning strategy based on the BIC and adjusted BIC when comparing the four class model to other models of two to five classes. The study showed that Taiwanese students who were classified under the “multiple strategies” and “elaboration and control strategies” group (multiple learning strategy) tend to score higher than average while students classified under the “memorization” and “control” group (single learning strategy) performed lower than average.
Data Preparation
From the PISA 2015 Database, we only used the files relevant for the project which are the student questionnaire data, school questionnaire data, and cognitive item data. The other files which were not relevant for us were the teacher questionnaire data and the questionnaire timing data. We also used the codebook data file for easy reference.
Upon initial exploration of the cognitive item data, which contains information on how students answered mathematics, reading, and science questions, we noticed that there were multiple booklets used and discovered a pattern. Booklets 31 to 96 were used for schools in Singapore and all booklets contained questions for Science together with Reading and/or Mathematics questions or just purely Science questions. Each booklet contained various number of questions and thus the total scores of each student cannot be compared across booklets. LCA will be used to determine the difficulty of the each question based on how well the students performed for the question and then the questions will be adjusted based on the difficulty.
Filtering to Singapore Data
From the raw files extracted from the PISA 2015 database, we only kept those with the 3 character country code of “SGP” as we only want the data related to Singapore. This is applied to the student questionnaire data, teacher questionnaire data and cognitive item data. This provided us with 6115 students and 177 schools of which 168 are public schools while the other 9 are private schools.
Removed columns with no response or same value in all entries
The next step was to remove columns with no responses from all schools and students. Columns that contained the same value in all entries were also removed such as Region and OECD Country. For the student questionnaire data and teacher questionnaire data, this is the last step for data preparation while more steps are needed for the cognitive item data in terms of having a standardized score for each student.
Kept scored and coded responses from cognitive data
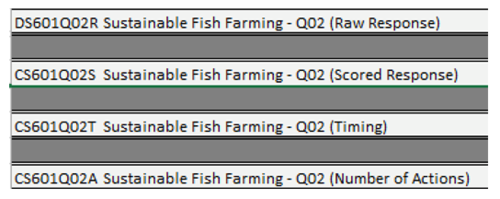
In the cognitive item data, each question contained several information such as raw response, scored response, timing, and number of actions. The only columns which were kept for the cognitive item data were the scored responses or coded responses as this contains the information on whether the student received any points for the question.
Adjust Scores
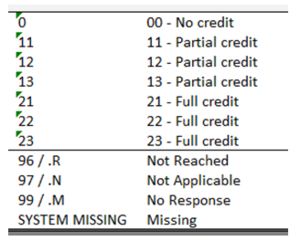
Questions in the cognitive item data were scored differently as some questions were given the value of 1 for partial credit and 2 for full credit. We decided to allocate 0 for no credit, 0.5 for partial credit, and 1 for full credit. For missing values, the value of 9999 was given.
Transposed Questions
In Excel, each student belonged to a row and the columns contained the student’s score for the questions that were answered. We then transposed the questions from columns to rows in JMP Pro to get the count and distribution of scoring classification for each question.
As there were different booklets used, each student only answered a small portion of all the questions that were available. When the cognitive item data was transposed into JMP Pro, the questions which were not in the booklet answered by the students were also included and this gave a total of 2,109,675 rows. After removing rows which did not contain any value in N(0), N(0.5), N(1), and N(9999), we were left with 314,366 rows.
Bin Scoring Classifications
We then proceeded to bin the scoring classifications based on its distribution for every question. 10 bins were used of 10% ranges. The data is then ready for LCA after this step.
Data Analysis
Latent Class Analysis
With the binned scoring classifications, latent class analysis can be performed to determine the most likely difficulty of the questions. To determine the number of clusters to be used, a selection of 2 to 5 clusters was chosen to determine the best fit to the data. The Bayesian information criteria (BIC) was looked at in order to determine the best model fit.
From the results, the Bayesian information criteria (BIC) was looked at for two to five clusters and the lowest value was determined to be the model with the best fit. From table 1, we could see that the latent class analysis with 4 clusters provided the best fit with a BIC value of 2921.4. However, the latent class analysis with 3 clusters also provided a low BIC value of 2927.15 and thus, we decided to use the latent class analysis with 3 clusters to signify the 3 difficulties for the questions which are easy, medium, and hard.
Discussion on LCA Results
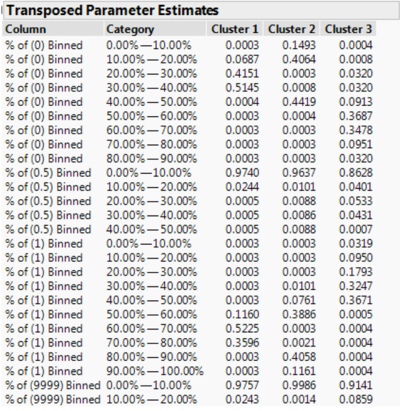
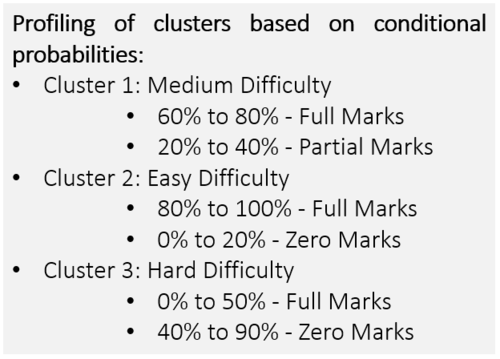
From the transposed parameter estimates, the probability of each question’s most likely difficulty can be determined based on the conditional probabilities of each cluster. From cluster 1, we can see that the biggest contributor comes from 60.00% to 80.00% of % of (1) Binned which are questions where students have gotten full marks and the second biggest contributor comes from 20.00% to 40.00% of % of (0) Binned which are questions where students have gotten no marks. From the contributors we can profile this cluster to be questions which have medium difficulty. For cluster 2, the biggest contributor comes from 80.00% to 100.00% of % of (1) Binned and 0.00% to 20.00% of % of (0) Binned which means these are questions where students generally get full marks and thus we can profile this cluster to be questions which have easy difficulty. For cluster 3, the biggest contributors are 0.00% to 50.00% of % of (1) Binned, 40.00% to 90.00% of % of (0) Binned, and 10.00% to 40.00% of % of (0.5) Binned. We can profile this cluster to be questions which have hard difficulty since these are questions where more students get no marks or only partial marks.
Standardized Scoring
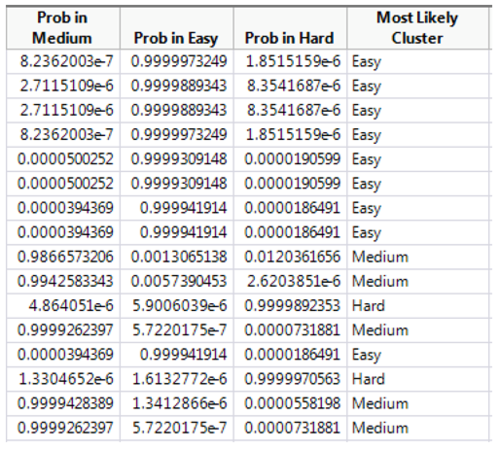
From the latent class analysis, 3 columns are created in the data table with the binned scoring classifications which are the probability of each difficulty (easy, medium, and hard). From these 3 columns, the most likely cluster is derived based on the column with the highest probability.
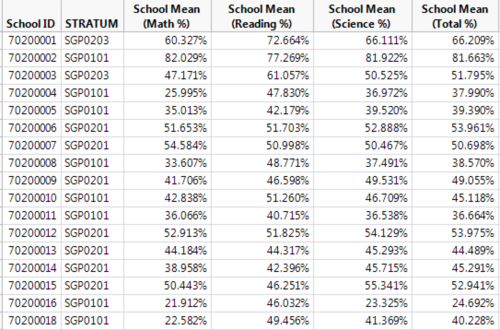
Each question’s weight is then adjusted based on the difficulty of the question and the total score for each student can then be computed for. With the adjusted total score for every student, each school’s performance can be calculated for based on the scores of the students.
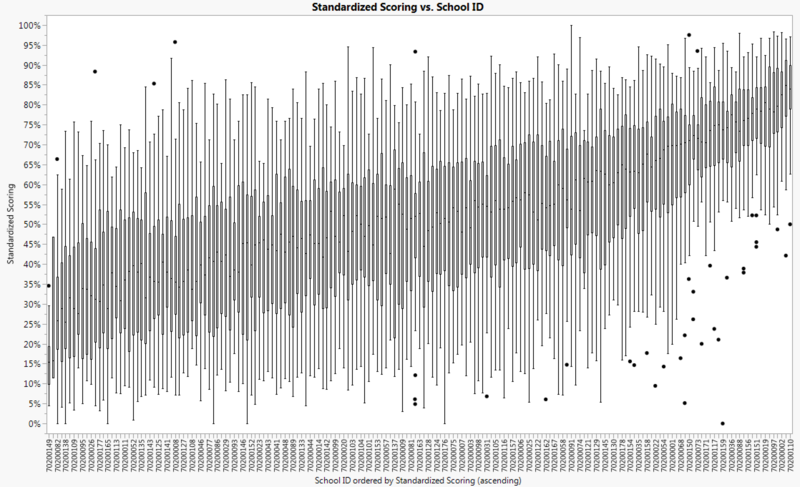
Looking at the boxplot of the scores of all schools, we see how schools in Singapore are different in terms of their performance. There are schools which perform exceptionally well as seen in the right side of the image below while there are also schools which did not perform well which is contrary to the notion of every school being a good school. Another point to highlight in the box plot is the number of outliers for schools which performed well. Although majority of the students in the high performing schools did well, there are a lot more outliers compared to schools in the middle and bottom tier.
Conclusion
Through latent class analysis, questions were placed in clusters and these clusters were profiled based on the parameter estimates to determine the associated difficulty of the cluster (easy, medium, or hard). Each question’s weight was then adjusted to get the standardized score of every student for comparison. Through the analysis, there is indeed a difference between schools in Singapore based on their performance in the 2015 PISA global education survey.


