Difference between revisions of "AY1516 T2 Team Hew - Prediction"
Jump to navigation
Jump to search
| Line 35: | Line 35: | ||
== <p style="font-family:Trebuchet MS; border-left: 6px solid #62b762; padding-left:10px; line-height:40px; height:40px"><b>Distribution Fitting</b></p>== | == <p style="font-family:Trebuchet MS; border-left: 6px solid #62b762; padding-left:10px; line-height:40px; height:40px"><b>Distribution Fitting</b></p>== | ||
| − | + | Vaughn (1996) and a number of actuaries have mentioned that ClaimPaid amounts have to factor in inflation for greater accuracy. However, as the highest inflation rate attained by Indonesia for the time period of study is about 7%, this is rather negligible. We first excluded rows where ClaimPaid = 0 and derived the distribution statistics of: | |
| + | <br /> | ||
| + | {| class="wikitable" style="text-align: center; width: 70%; margin-left: auto; margin-right: auto; border: none;" | ||
| + | |- | ||
| + | ! N !! Min !! Max !! Median !! Mean !! Standard Deviation | ||
| + | |- | ||
| + | | 49,066 || 2,570 || 3,295,056,701 || 4,297,418 || 21,090,896 || 90,927,485 | ||
| + | |} | ||
| + | <br /> | ||
| + | [[File:ClaimPaidOverall.png|center|Overall Claim amount distribution]] | ||
| + | |||
| + | |||
</div> | </div> | ||
Revision as of 10:41, 17 April 2016
| Exploratory Analysis | Prediction |
Distribution Fitting
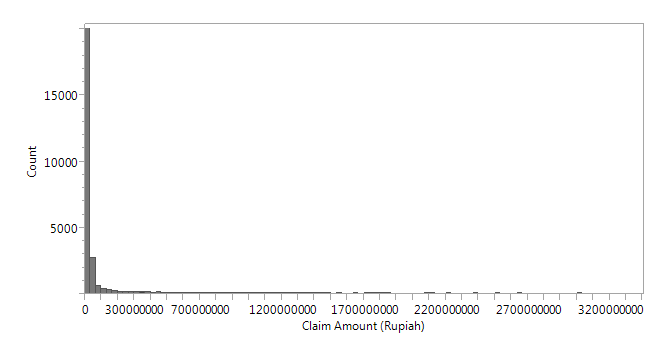
Vaughn (1996) and a number of actuaries have mentioned that ClaimPaid amounts have to factor in inflation for greater accuracy. However, as the highest inflation rate attained by Indonesia for the time period of study is about 7%, this is rather negligible. We first excluded rows where ClaimPaid = 0 and derived the distribution statistics of:
| N | Min | Max | Median | Mean | Standard Deviation |
|---|---|---|---|---|---|
| 49,066 | 2,570 | 3,295,056,701 | 4,297,418 | 21,090,896 | 90,927,485 |

Linear Regression
Coming Soon
Research & Methodology
Coming Soon
References