Difference between revisions of "ANLY482 AY2017-18 T2 Group 15"
Jump to navigation
Jump to search
Final Report, USDA and Poster Presentation in Progress
m |
|||
| Line 53: | Line 53: | ||
::The study begins with the business and research motivations in implementing improved data visualization methods, supported by a literature review of the business advantages of data visualization and structuring. It then explains the data-cleaning and transformation processes in converting raw data into the flat data structure necessary for visualization, and an explanation of each data type. This is followed by in-depth discussions comparing the performance of the three proposed visualization platforms for the client. Finally, the most suitable platform is selected with justification, along with plans and recommendations for the client moving forward. | ::The study begins with the business and research motivations in implementing improved data visualization methods, supported by a literature review of the business advantages of data visualization and structuring. It then explains the data-cleaning and transformation processes in converting raw data into the flat data structure necessary for visualization, and an explanation of each data type. This is followed by in-depth discussions comparing the performance of the three proposed visualization platforms for the client. Finally, the most suitable platform is selected with justification, along with plans and recommendations for the client moving forward. | ||
| − | As a project team, we aim to improve our client’s data processing and analytics methods to improve their efficiency, provide clearer and more dynamic visualizations, and allow them to make improved marketing decisions. | + | ::As a project team, we aim to improve our client’s data processing and analytics methods to improve their efficiency, provide clearer and more dynamic visualizations, and allow them to make improved marketing decisions. |
Revision as of 17:10, 15 April 2018
PROJECT DESCRIPTION
- Advanced data visualization is a powerful analytical tool. With the necessary data, an ideal set of visualizations provides clear information about sales trends and operational data and is highly adaptable to users’ changing needs. This helps businesses better understand their strengths, weaknesses, and performance against competitors, and make quicker and more effective business decisions. A competitive edge is thus obtained against users of primitive data visualization methods, such as static charts and graphs - which are less customizable, take more time to update and provide less information in the long run.
- This research study will explore the benefits of data visualization improvements on a client, which is a well-established Fast-Moving Consumer Goods (FMCG) company. The study will use actual data for distribution, sales, Key Performance Indicators (KPIs) and price between 2014 and 2017. The data is currently visualized in a simple Excel dashboard, which provides limited information. The study will assess the suitability of two more powerful and sophisticated visualization methods – Tableau and Qlik Sense – and recommend the platform which best suits the client’s needs.
- The study begins with the business and research motivations in implementing improved data visualization methods, supported by a literature review of the business advantages of data visualization and structuring. It then explains the data-cleaning and transformation processes in converting raw data into the flat data structure necessary for visualization, and an explanation of each data type. This is followed by in-depth discussions comparing the performance of the three proposed visualization platforms for the client. Finally, the most suitable platform is selected with justification, along with plans and recommendations for the client moving forward.
- As a project team, we aim to improve our client’s data processing and analytics methods to improve their efficiency, provide clearer and more dynamic visualizations, and allow them to make improved marketing decisions.
PROJECT STATUS
80% completed

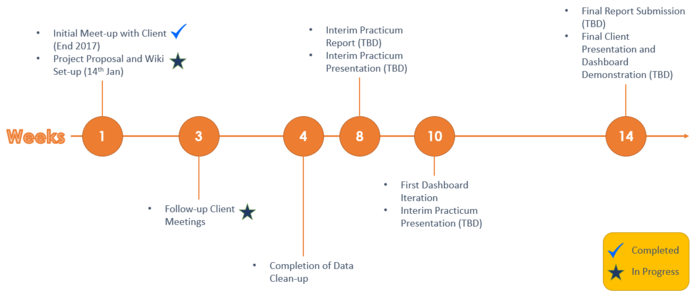
PROJECT DELIVERABLES
14 Jan 2018: Proposal Submission - 23:59
- Wikipage - 5%
- Proposal Report - 10%
25 Feb 2018 Interim Report - 23:59
- Interim Report (wikipage) - 5%
- Analytical Sandbox - 15%
26 Feb 2018 - 4 Mar 2018: Interim Presentation - (08:30 – 11:30, 13:30-17.30)
- Interim Presentation - 10%
01 Apr 2018: Undergraduate Conference Abstract Submission - 23:59
- Conference Abstract - 5%
08 Apr 2018: Undergraduate Conference Full Paper Submission - 23:59
- Conference Paper - 20%
- Poster - 10%
14-15 Apr 2018: Undergraduate Conference Days - (09:00 - 18:00)
22 Apr 2018: Final Submission - 23:59
- Analytical Sandbox and Code - 15%
- Wikipage - 5%