Difference between revisions of "ANLY482 AY2017-18 T1 Group2 Project EZLin Midterm"
Jump to navigation
Jump to search
| Line 36: | Line 36: | ||
|} | |} | ||
<!--/Sub Header--> | <!--/Sub Header--> | ||
| − | + | <br/> | |
| − | + | == ER Diagram== | |
| + | <br/> | ||
<center> | <center> | ||
| − | [[File:EZLin | + | [[File:ER EZLin.png|800px]] |
| + | </center> | ||
| + | <br/> | ||
| + | == Visualization == | ||
| + | <br/> | ||
| + | We used JMP for visualization, in order to see the relationships between products of different levels and the manufacturing plant or distribution centers. | ||
| + | <center> | ||
| + | [[File:EZLin Picture1.png|800px]] | ||
</center> | </center> | ||
<br/> | <br/> | ||
Revision as of 00:35, 29 September 2017
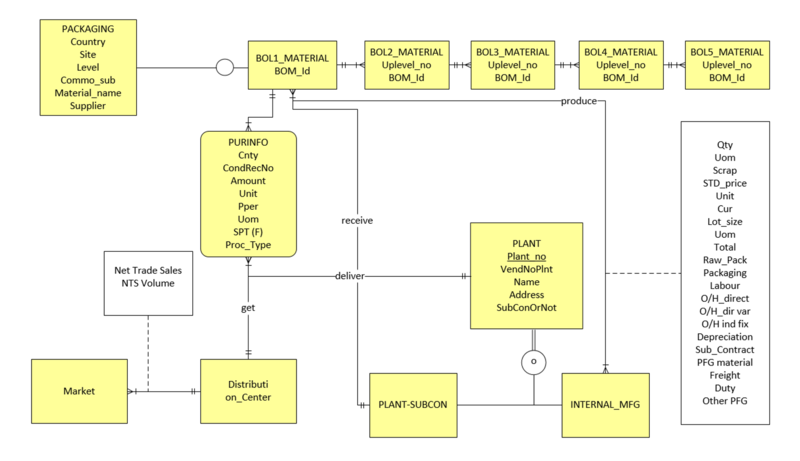
ER Diagram
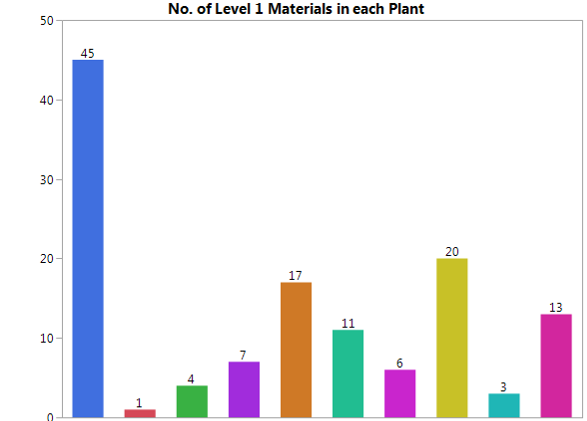
Visualization
We used JMP for visualization, in order to see the relationships between products of different levels and the manufacturing plant or distribution centers.

