ANLY482 AY2017-18 T1 Group2 Project EZLin Final
Data Transformation
The overall process:
1.Combined all excel files containing detailed cost component information.
2.Add SerialCode column and Bom_Id colum.
3.Merged the combined excel file (containing all the cost components) with material master.xlsx file to get the Special Procurement Type (SPT) for each material.
4.Join the table with Special procurement type description.xlsx to get the Long Text which contains the original plant no.
5.Joined with the putup.xlsx and variant.xlsx.
6.Transform all cost values to USD and Litre(KG) unit.
7.Transpose the table.
8.Merge the consolidated data file with the Packaging Data.xlsx and ChemicalWithPlantCode.xlsx
ps. Details of this part are under the methodology tab.
Visualization and Report Generation
1. Tableau visualization
1.1 Manufacturing Cost
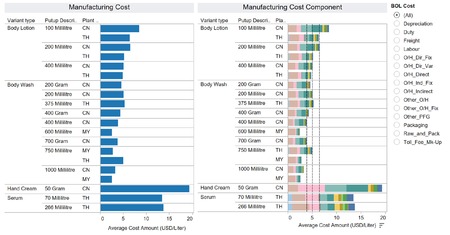
To compare the difference between manufacturing cost in different countries, we placed Average Cost Amount under Columns and Variant type, Putup Description and Plant Cty under Rows
1.2 Distribution Cost
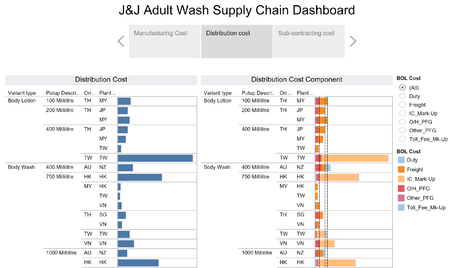
To compare the difference between distribution cost, one additional column Ori Plant Cty is placed in front of Plant Cty.
1.3 Subcontracting Cost
The Subcontracting cost is relatively similar to the distribution cost. The only difference between this two is the filtering of the Procurement Type to “X” instead of “F” and filtering the Type of cost to “Subcon” cost.
1.4 Dashboard
Following the creation of the different worksheets, we combined the overall manufacturing cost and manufacturing cost component into a single dashboard, the overall distribution cost and distribution cost component in another dashboard and the overall subcontracting cost and subcontracting cost component into a third dashboard (Figure 25)

Figure 25 Manufacturing cost dashboard

Figure 26 Distribution cost in Supply Chain storyboard
1.5 Chemical data
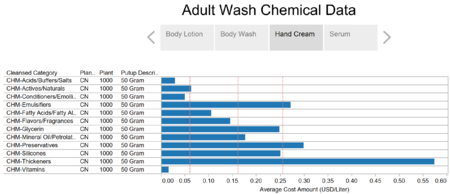
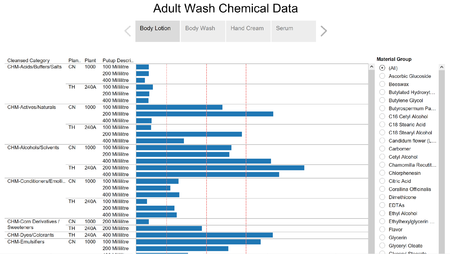
To view the cost of chemical used in various product, we used a storyboard similar to the supply chain storyboard.

Figure 27 Hand Cream chemical cost in Chemical Data storyboard

Figure 28 Chemical data storyboard
1.6 Packaging Data
We also used an individual dashboard to show the comparison of packing cost between different countries, through putting Average Cost Amount in columns and Primary/Secondary, Putup Description, Plant Cty, and Plant in rows.
2. Story telling
2.1 Supply Chain Cost
In general, the overall manufacturing cost in China is higher than the cost in Thailand and Malaysia based on the chart.
2.2 Chemical Data
The manufacturing cost in China is higher because its labour cost is around twice the labour cost in Malaysia and Thailand on average.
2.3 Packing Data
For Body Lotion primary packing data, the cost variation around different countries are generally the same. For some, it is more expensive in China while for others, it is more expensive in Thailand.
ps. Details of this part are under the methodology tab.