Difference between revisions of "ANLY482 AY2017-18 T2 Group 15"
Jump to navigation
Jump to search
| (40 intermediate revisions by 3 users not shown) | |||
| Line 1: | Line 1: | ||
| − | {|style="background-color:# | + | <font face="Helvetica"> |
| − | + | {| style="background-color:#FFFFFF; color:#ffcc16 padding: 5px 0 0 0;" width="100%" cellspacing="0" cellpadding="0" valign="top" border="0" | | |
| − | + | | style="padding:0.3em; font-family:Arimo; font-size:110%; border-bottom:4px solid #aaaaaa; border-top:4px solid #aaaaaa; background:#d8d8d8; text-align:center;" width="10%" | | |
| − | | style="padding:0. | + | [[ANLY482_AY2017-18_T2_Group 15 |<font face ="Helvetica" color="#3f3d3d"><strong>HOME</strong></font>]] |
| − | + | | style="padding:0.3em; font-family:Arimo; font-size:110%; border-bottom:4px solid #aaaaaa; border-top:4px solid #aaaaaa; background:#ffcc16; text-align:center;" width="10%" | | |
| − | | style="padding:0. | + | [[ANLY482_AY2017-18_T2_Group15_Project_Overview|<font face ="Helvetica" color="#3f3d3d"><strong> PROJECT OVERVIEW</strong></font>]] |
| − | + | | style="padding:0.3em; font-family:Arimo; font-size:110%; border-bottom:4px solid #aaaaaa; border-top:4px solid #aaaaaa; background:#ffcc16; text-align:center;" width="10%" | | |
| − | | style="padding:0. | + | [[ANLY482_AY2017-18_T2_Group15_Data_Analysis|<font face ="Helvetica" color="#3f3d3d"><strong> DATA ANALYSIS</strong></font>]] |
| − | | style="background: | + | | style="padding:0.3em; font-family:Arimo; font-size:110%; border-bottom:4px solid #aaaaaa; border-top:4px solid #aaaaaa; background:#ffcc16; text-align:center;" width="10%" | |
| − | | style="padding:0. | + | [[ANLY482_AY2017-18_T2_Group15_Documentation|<font face ="Helvetica" color="#3f3d3d"><strong> DOCUMENTATION</strong></font>]] |
| + | |||
| + | | style="padding:0.3em; font-family:Arimo; font-size:110%; border-bottom:4px solid #aaaaaa; border-top:4px solid #aaaaaa; background:#ffcc16; text-align:center;" width="10%" | | ||
| + | [[ANLY482_AY2017-18_T2_Group15_Recommendations|<font face ="Helvetica" color="#3f3d3d"><strong> RECOMMENDATIONS</strong></font>]] | ||
| + | |||
| + | | style="padding:0.3em; font-family:Helvetica; font-size:110%; border-bottom:4px solid #aaaaaa; border-top:4px solid #aaaaaa; background:#ffcc16; text-align:center;" width="10%" | | ||
| + | [[ANLY482_AY2017-18_T2_Group15_About_group|<font face ="Helvetica" color="#3f3d3d"><strong>ABOUT US </strong></font>]] | ||
| + | |||
| + | | style="padding:0.3em; font-family:Helvetica; font-size:110%; border-bottom:4px solid #aaaaaa; border-top:4px solid #aaaaaa; background:#ffcc16; text-align:center;" width="10%" | | ||
| + | [[ANLY482_AY2017-18_Term_2|<font face ="Helvetica" color="#3f3d3d"><strong>BACK TO MAIN ANLY82 </strong></font>]] | ||
| + | |||
| + | |} | ||
| + | <!------ END OF TOP HEADER -----> | ||
| + | |||
| + | <!--Sub Header--> | ||
| + | |||
| + | {| style="background-color:white; color:white padding: 5px 0 0 0;" width="100%" height=50px cellspacing="0" cellpadding="0" valign="top" border="0" | | ||
| + | |||
| + | | style="vertical-align:top;width:50%;" | <div style="padding: 1px; text-align:center; line-height: wrap_content; font-size:14px; border-top:3px solid #ffcc16;border-bottom:3px solid #ffcc16 "> [[ANLY482 AY2017-18 T2 Group15 Home Version 1| <font color="#000000"><b>'''VERSION 1'''</b>]] | ||
| + | |||
| + | | style="vertical-align:top;width:50%;" | <div style="padding: 1px; text-align:center; line-height: wrap_content; font-size:14px; border-top:3px solid #ffcc16;background:#545454;border-bottom:3px solid #ffcc16"> [[ANLY482_AY2017-18_T2_Group 15 | <font color="#FFFFFF"><b>FINAL</b>]] | ||
| | | | ||
| + | |||
|} | |} | ||
| + | | ||
| + | <!--/Sub Header--> | ||
| + | <!------ START OF DETAILS-----> | ||
| + | <div align="left"> | ||
| + | <div style="background: #ffebba; padding: 12px;font-family:Helvetica; font-size: 15px; font-weight: bold; line-height: 1em; text-indent: 15px; border-left: #ffcc16 solid 10px; border-right: #ffcc16 solid 10px; text-align:center "><font color="#3f3d3d">PROJECT DESCRIPTION</font></div> | ||
| + | <br/> | ||
| + | ::Data visualization software is a powerful analytical tool. With the necessary data, an ideal set of visualizations provides clear information about sales trends and operational data and is highly adaptable to users’ changing needs. This helps businesses better understand their strengths, weaknesses, and performance against competitors, and make quicker and more effective business decisions. A competitive edge is thus obtained against users of primitive data visualization methods, such as static charts and graphs - which are less customizable, take more time to update and provide less information in the long run. | ||
| + | |||
| + | ::This project will explore the benefits of data visualization improvements on a client, which is a well-established Fast-Moving Consumer Goods (FMCG) company. The study will use actual data for distribution, sales, Key Performance Indicators (KPIs) and price between 2014 and 2017. The data is currently visualized in a simple Excel dashboard, which provides limited information. In this project, we begin with data-cleaning and transformation processes in converting raw data into the flat data structure necessary for visualization, then assess the suitability of two more powerful and sophisticated visualization methods – Tableau and Qlik Sense. Finally, we recommend the platform which best suits the client’s needs, along with plans and recommendations for the client moving forward. | ||
| + | |||
| + | ::As a project team, we aim to improve our client’s data processing and analytics methods to improve their efficiency, provide clearer and more dynamic visualizations, and allow them to make improved marketing decisions. | ||
| + | |||
| + | |||
| + | <br/> | ||
| + | <div align="center"> | ||
| + | <div style="background: #ffebba; padding: 12px; font-family:Helvetica; font-size: 15px; font-weight: bold; line-height: 1em; text-indent: 15px; border-left: #ffcc16 solid 10px; border-right: #ffcc16 solid 10px; text-align:center "><font color="#3f3d3d">PROJECT STATUS</font></div> | ||
| + | |||
| + | <br> | ||
| + | {{Progress bar|100|height = 10px| text = completed |width = 50%}} | ||
<br/> | <br/> | ||
| − | <div style="background: # | + | |
| + | [[File:Group15timeline.PNG|700px|center]] | ||
| + | <br/> | ||
| + | |||
| + | <div align="centre"> | ||
| + | <div style="background: #ffebba; padding: 12px; font-family:Helvetica; font-size: 15px; font-weight: bold; line-height: 1em; text-indent: 15px; border-left: #ffcc16 solid 10px; border-right: #ffcc16 solid 10px; text-align:center "><font color="#3f3d3d">PROJECT DELIVERABLES</font></div> | ||
<div> | <div> | ||
| − | <b>14 Jan 2018:</b> Proposal | + | <b>14 Jan 2018:</b> Proposal Submission - 23:59 |
| − | : | + | :Wikipage - 5% |
| − | : | + | :Proposal Report - 10%<br /><br /> |
| − | <b>25 Feb 2018</b> Interim | + | <b>25 Feb 2018</b> Interim Report - 23:59 |
| − | : | + | :Interim Report (wikipage) - 5% |
| − | : | + | :Analytical Sandbox - 15%<br /><br /> |
| − | <b>26 Feb 2018 - 4 Mar 2018: </b> Interim | + | <b>26 Feb 2018 - 4 Mar 2018: </b> Interim Presentation - (08:30 – 11:30, 13:30-17.30) |
| − | : | + | :Interim Presentation - 10%<br /><br /> |
| − | <b>01 Apr 2018:</b> Undergraduate | + | <b>01 Apr 2018:</b> Undergraduate Conference Abstract Submission - 23:59 |
| − | : | + | :Conference Abstract - 5%<br /><br /> |
| − | <b>08 Apr 2018: </b> Undergraduate | + | <b>08 Apr 2018: </b> Undergraduate Conference Full Paper Submission - 23:59 |
| − | : | + | :Conference Paper - 20% |
| − | : | + | :Poster - 10%<br /><br /> |
| − | <b> | + | <b>12-13 Apr 2018: </b> Undergraduate Conference Days - (09:00 - 18:00)<br /><br /> |
| − | <b> | + | <b>15 Apr 2018: </b> Final Submission - 23:59 |
| − | : | + | :Analytical Sandbox and Code - 15% |
| − | : | + | :Wikipage - 5%<br /><br /> |
</div> | </div> | ||
Latest revision as of 20:47, 15 April 2018
PROJECT DESCRIPTION
- Data visualization software is a powerful analytical tool. With the necessary data, an ideal set of visualizations provides clear information about sales trends and operational data and is highly adaptable to users’ changing needs. This helps businesses better understand their strengths, weaknesses, and performance against competitors, and make quicker and more effective business decisions. A competitive edge is thus obtained against users of primitive data visualization methods, such as static charts and graphs - which are less customizable, take more time to update and provide less information in the long run.
- This project will explore the benefits of data visualization improvements on a client, which is a well-established Fast-Moving Consumer Goods (FMCG) company. The study will use actual data for distribution, sales, Key Performance Indicators (KPIs) and price between 2014 and 2017. The data is currently visualized in a simple Excel dashboard, which provides limited information. In this project, we begin with data-cleaning and transformation processes in converting raw data into the flat data structure necessary for visualization, then assess the suitability of two more powerful and sophisticated visualization methods – Tableau and Qlik Sense. Finally, we recommend the platform which best suits the client’s needs, along with plans and recommendations for the client moving forward.
- As a project team, we aim to improve our client’s data processing and analytics methods to improve their efficiency, provide clearer and more dynamic visualizations, and allow them to make improved marketing decisions.
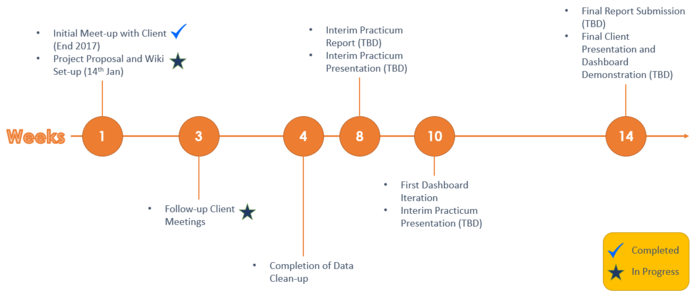
PROJECT STATUS
100% completed

PROJECT DELIVERABLES
14 Jan 2018: Proposal Submission - 23:59
- Wikipage - 5%
- Proposal Report - 10%
25 Feb 2018 Interim Report - 23:59
- Interim Report (wikipage) - 5%
- Analytical Sandbox - 15%
26 Feb 2018 - 4 Mar 2018: Interim Presentation - (08:30 – 11:30, 13:30-17.30)
- Interim Presentation - 10%
01 Apr 2018: Undergraduate Conference Abstract Submission - 23:59
- Conference Abstract - 5%
08 Apr 2018: Undergraduate Conference Full Paper Submission - 23:59
- Conference Paper - 20%
- Poster - 10%
12-13 Apr 2018: Undergraduate Conference Days - (09:00 - 18:00)
15 Apr 2018: Final Submission - 23:59
- Analytical Sandbox and Code - 15%
- Wikipage - 5%