Difference between revisions of "Computational Transportation Science Findings"
Jump to navigation
Jump to search
| (One intermediate revision by the same user not shown) | |||
| Line 1: | Line 1: | ||
| − | + | <!------- Navigation Bar----> | |
{| style="background-color:#0000f0 ; color:#0000f0 padding: 5px 0 0 0;" width="100%" cellspacing="0" cellpadding="0" valign="top" border="0" | | {| style="background-color:#0000f0 ; color:#0000f0 padding: 5px 0 0 0;" width="100%" cellspacing="0" cellpadding="0" valign="top" border="0" | | ||
| style="padding:0.3em; font-family:Century Gothic; font-size:100%; border-bottom:2px solid #FE2E2E; border-top:2px solid #0000f0; border-left:2px #FE2E2E; background: #F4FA58; text-align:center;" width="16.7%" | | | style="padding:0.3em; font-family:Century Gothic; font-size:100%; border-bottom:2px solid #FE2E2E; border-top:2px solid #0000f0; border-left:2px #FE2E2E; background: #F4FA58; text-align:center;" width="16.7%" | | ||
| − | [[ | + | [[Time-series Analysis on Singapore Public Transportation Train Network|<font color="#000000"><strong>Home</strong></font>]] |
| style="border-bottom:2px solid #0000f0 ; border-top:2px solid #000066; border-left:2px solid #000066; background:#FE2E2E;" width="1%" | | | style="border-bottom:2px solid #0000f0 ; border-top:2px solid #000066; border-left:2px solid #000066; background:#FE2E2E;" width="1%" | | ||
| style="padding:0.3em; font-family:Century Gothic; font-size:100%; border-bottom:2px solid #FE2E2E; border-top:2px solid #0000f0; background:#F4FA58; text-align:center;" width="16.7%" | | | style="padding:0.3em; font-family:Century Gothic; font-size:100%; border-bottom:2px solid #FE2E2E; border-top:2px solid #0000f0; background:#F4FA58; text-align:center;" width="16.7%" | | ||
| − | [[ | + | [[Time-series Analysis on Singapore Public Transportation Train Network_Project Overview|<font color="#000000"><strong>Project Overview</strong></font>]] |
| style="border-bottom:2px solid #000066; border-top:2px solid #000066; background:#FE2E2E;" width="1%" | | | style="border-bottom:2px solid #000066; border-top:2px solid #000066; background:#FE2E2E;" width="1%" | | ||
| style="padding:0.3em; font-family:Century Gothic; font-size:100%; border-bottom:2px solid #FE2E2E; border-top:2px solid #0000f0; background:#F4FA58; text-align:center;" width="16.7%" | | | style="padding:0.3em; font-family:Century Gothic; font-size:100%; border-bottom:2px solid #FE2E2E; border-top:2px solid #0000f0; background:#F4FA58; text-align:center;" width="16.7%" | | ||
| − | [[ | + | [[Time-series Analysis on Singapore Public Transportation Train Network_Findings|<font color="#000000"><strong>Findings</strong></font>]] |
| style="border-bottom:2px solid #000066; border-top:2px solid #000066; background:#FE2E2E;" width="1%" | | | style="border-bottom:2px solid #000066; border-top:2px solid #000066; background:#FE2E2E;" width="1%" | | ||
| style="padding:0.3em; font-family:Century Gothic; font-size:100%; border-bottom:2px solid #FE2E2E; border-top:2px solid #0000f0; background:#F4FA58; text-align:center;" width="16.7%" | | | style="padding:0.3em; font-family:Century Gothic; font-size:100%; border-bottom:2px solid #FE2E2E; border-top:2px solid #0000f0; background:#F4FA58; text-align:center;" width="16.7%" | | ||
| − | [[ | + | [[Time-series Analysis on Singapore Public Transportation Train Network_Project Documentation|<font color="#000000"><strong>Project Documentation</strong></font>]] |
| style="border-bottom:2px solid #000066; border-top:2px solid #000066; background:#FE2E2E;" width="1%" | | | style="border-bottom:2px solid #000066; border-top:2px solid #000066; background:#FE2E2E;" width="1%" | | ||
| style="padding:0.3em; font-family:Century Gothic; font-size:100%; border-bottom:2px solid #FE2E2E; border-top:2px solid #0000f0; background:#F4FA58; text-align:center;" width="16.7%" | | | style="padding:0.3em; font-family:Century Gothic; font-size:100%; border-bottom:2px solid #FE2E2E; border-top:2px solid #0000f0; background:#F4FA58; text-align:center;" width="16.7%" | | ||
| − | [[ | + | [[Time-series Analysis on Singapore Public Transportation Train Network_Project Management|<font color="#000000"><strong>Project Management</strong></font>]] |
|} | |} | ||
<!---------------START of sub menu ----------------------> | <!---------------START of sub menu ----------------------> | ||
{| style="background-color:#ffffff; margin: 3px auto 0 auto" width="55%" | {| style="background-color:#ffffff; margin: 3px auto 0 auto" width="55%" | ||
|- | |- | ||
| − | ! style="font-size:15px; text-align: center; border-top:solid #ffffff; border-bottom:solid #2e2e2e" width="150px"| [[ | + | ! style="font-size:15px; text-align: center; border-top:solid #ffffff; border-bottom:solid #2e2e2e" width="150px"| [[Time-series Analysis on Singapore Public Transportation Train Network_Findings| <span style="color:#3d3d3d">Mid-Term</span>]] |
! style="font-size:15px; text-align: center; border-top:solid #ffffff; border-bottom:solid #ffffff" width="20px"| | ! style="font-size:15px; text-align: center; border-top:solid #ffffff; border-bottom:solid #ffffff" width="20px"| | ||
| − | ! style="font-size:15px; text-align: center; border-top:solid #ffffff; border-bottom:solid #ffffff" width="150px"| [[ | + | ! style="font-size:15px; text-align: center; border-top:solid #ffffff; border-bottom:solid #ffffff" width="150px"| [[Time-series Analysis on Singapore Public Transportation Train Network_Finals| <span style="color:#3d3d3d">Finals</span>]] |
! style="font-size:15px; text-align: center; border-top:solid #ffffff; border-bottom:solid #ffffff" width="20px"| | ! style="font-size:15px; text-align: center; border-top:solid #ffffff; border-bottom:solid #ffffff" width="20px"| | ||
|} | |} | ||
Latest revision as of 17:45, 14 April 2015
| Mid-Term | Finals |
|---|
| Exploratory Data Analysis for Knowledge Discovery |
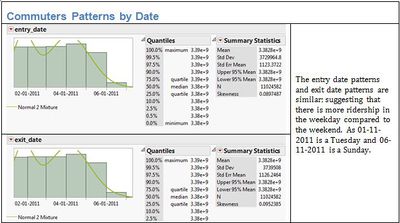
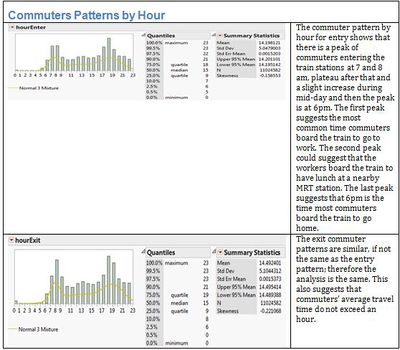
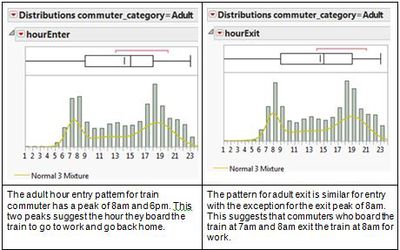
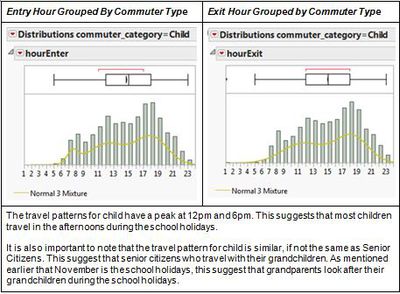
In this phase of the project we attempt knowledge discovery from the provided dataset using a mixture of basic statistics and visualization methods. We will breakdown the analysis into different categories:
- Analysis on Individual Variables
- Analysis on Commuter's patterns by commuter's type
- Analysis on Commuter's patterns by different zone
Here is only a sample of a few analysis for the different variables, to view the rest of the variables and for more detailed explanation please refer to our Report.
| Analysis on Individual Variable |
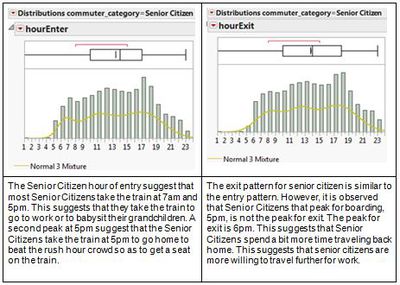
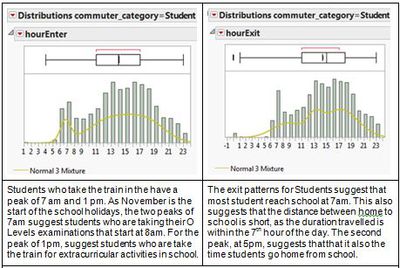
| Analysis on Commuter's patterns by commuter's type - Hour Entered and Exit |
| Analysis on Commuter's patterns by different zone |
