Difference between revisions of "AY1516 T2 Inpatient Meals Survey ProjectOverview Data"
Jump to navigation
Jump to search

Image source: MRC Mediacorp Oct 2015-Nov 2015 Survey analysis
Poojat.2012 (talk | contribs) (Created page with "<center>200px</center> <!--Header Start--> {|style="background-color:#1d4c5d;" width="100%" cellspacing="0" cellpadding="0" valign="top" border="0...") |
Poojat.2012 (talk | contribs) |
||
| Line 47: | Line 47: | ||
==<div style="background: #848484; padding: 15px; font-weight: bold; line-height: 0.3em; text-indent: 15px; font-size:24px"><font color= #FFFFFF>Demographics</font></div>== | ==<div style="background: #848484; padding: 15px; font-weight: bold; line-height: 0.3em; text-indent: 15px; font-size:24px"><font color= #FFFFFF>Demographics</font></div>== | ||
<br/> | <br/> | ||
| − | + | [[Image:DataStats-Demographics1.png|500px]] | |
| − | + | [[Image:DataStats-Demographics2.png|500px]] | |
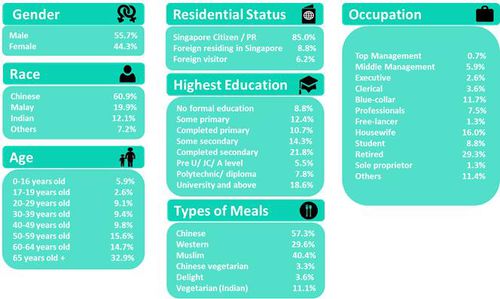
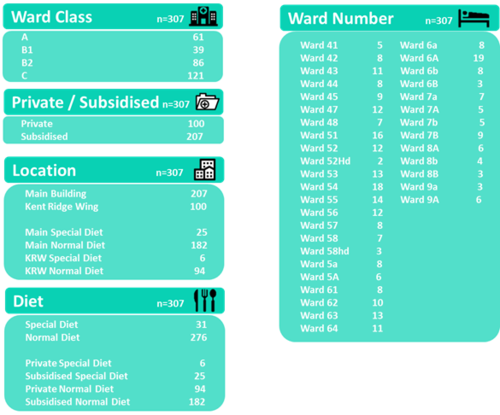
| − | + | <center><i>Image source: MRC Mediacorp Oct 2015-Nov 2015 Survey analysis</i></center> | |
| − | [[Image:DataStats-Demographics2.png| | ||
| − | <i>Image source: MRC Mediacorp</i></center> | ||
Revision as of 17:27, 28 February 2016

| Project Description | Data | Methodology |
|---|
Description of Data
MRC conducts a survey for Sodexo every two months regarding the food that they supply to the patients at NUH. They then produce the analysis on this collected data and provide insights to Sodexo on the food.
There are three interviewers who interview 50 patients every month. The patients are asked about the importance and satisfaction that they attach to 7-8 factors (depending on the class of the patient) of the food. This data is collected in a qualtrics survey format and generated as an Excel every two months. The data generated is clean and does not require any formatting.

