Difference between revisions of "ANLY482 AY2017-18 T2 Group15 Project Overview"
Jump to navigation
Jump to search
| Line 72: | Line 72: | ||
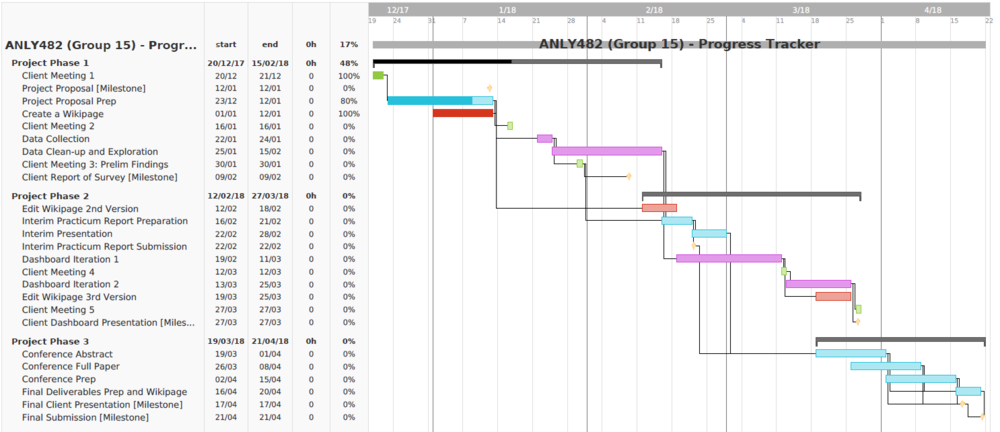
<div style="background: #ffebba; padding: 12px;font-family:Helvetica; font-size: 15px; font-weight: bold; line-height: 1em; text-indent: 15px; border-left: #ffcc16 solid 10px; border-right: #ffcc16 solid 10px; text-align:center "><font color="#3f3d3d">OUR WORK PLAN</font></div> | <div style="background: #ffebba; padding: 12px;font-family:Helvetica; font-size: 15px; font-weight: bold; line-height: 1em; text-indent: 15px; border-left: #ffcc16 solid 10px; border-right: #ffcc16 solid 10px; text-align:center "><font color="#3f3d3d">OUR WORK PLAN</font></div> | ||
<br/> | <br/> | ||
| + | [[file:Work plan.png|1000px|center]] | ||
Revision as of 20:44, 14 January 2018
OUR MOTIVATIONS
- To address the company’s concerns as stated by their representatives, our group aims to add value to the company by helping them to discover the determinants of a stronger brand – the extent to which advertising impacts sales. This would give the company’s marketing team a clear view of the concrete steps to take so their brands achieve increased market share.
- In addition, we aim to create a comprehensive information dashboard displaying statistics and analytics which will allow users to obtain a clear overview of sales trends, business outcomes from various marketing decisions, and other details to facilitate management’s decision-making process.
METHODOLOGY
- Our project methodology will consist of, but is not limited to, the following:
- 1. Correlation Analysis
- Correlation Analysis will be done between Marketing Expenditure and Brand Equity Scores. This will show how a particular marketing action affects the sales of the various beverage brands.
- 2. Market Basket Analysis
- This is an analysis between how the sales of different brands correlate to each other. One of the main deliverables of interest will be the analytics of cannibalization effects among the brands.
- 3. Seasonality Trends
- We will analyze how sales fluctuate on a broader scale, such as during holiday months and seasons, as well as how marketing campaigns affect sales trends.
- The main tool to be utilised will be JMP Pro 13. This tool is selected for its combination of statistical analyses capabilities and visualization features provided. The end deliverable will be an interactive, updatable (through synchronisation) HTML dashboard that is accessible through mobile devices.
SCOPE OF THE PROJECT
- We will be working with data of all beverage products sold by the company in Singapore. In terms of data, we will be working mainly with Marketing and Sales data as our primary focus is to link these two segments meaningfully.
DATA USED
- The data we obtain from the company will include historical sales figures, marketing expenditure, market share in comparison with competitors, distribution split across the company’s various channels, and brand equity scores.
OUR WORK PLAN
