Difference between revisions of "ANLY482 AY2017-18 T1 Group2 Project EZLin Midterm"
Jump to navigation
Jump to search
| Line 46: | Line 46: | ||
== Data Transformation == | == Data Transformation == | ||
The transformation in data that we have performed are listed below.<br/> | The transformation in data that we have performed are listed below.<br/> | ||
| − | * | + | * Integrating the purchase information files |
| − | * | + | * Integrating the Vendor and Plant files |
| − | * | + | * Integrating material master file |
| − | * | + | * Integrating dimension conversion |
| − | + | * Transform the value of Amount | |
| − | * Transform | + | * Integrating finishing products details <br/> |
| − | * | ||
'''More details will be presented in 'Data' under 'Project Overview' part!''' | '''More details will be presented in 'Data' under 'Project Overview' part!''' | ||
<br/><br/> | <br/><br/> | ||
Revision as of 18:51, 15 October 2017
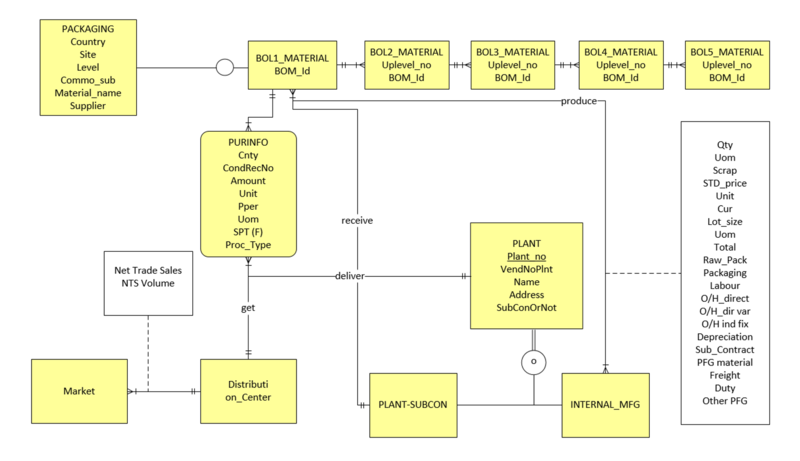
ER Diagram
ER diagram is used to present the relationship between the excel sheets that we have received.
Data Transformation
The transformation in data that we have performed are listed below.
- Integrating the purchase information files
- Integrating the Vendor and Plant files
- Integrating material master file
- Integrating dimension conversion
- Transform the value of Amount
- Integrating finishing products details
More details will be presented in 'Data' under 'Project Overview' part!
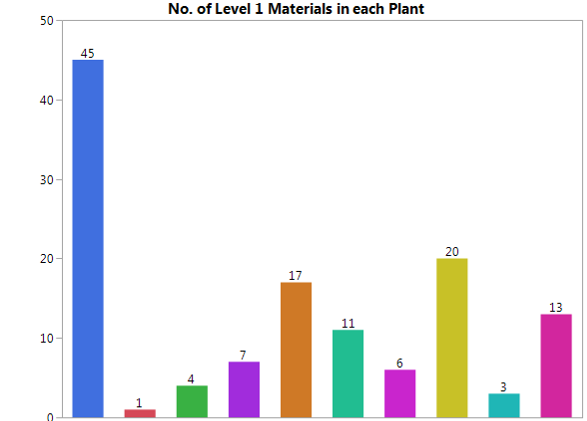
Visualization
We used JMP for visualization, in order to see the relationships between products of different levels and the manufacturing plant or distribution centers. One of the visualizations you can find below which shows the visualization of No. of Level 1 Products in each plant.

