Difference between revisions of "ANLY482 AY2016-17 T2 Group11: Project Findings"
| (2 intermediate revisions by the same user not shown) | |||
| Line 14: | Line 14: | ||
</div> | </div> | ||
| − | + | {| style="background-color:#FFFFFF; color:#000000 padding: 5px 0 0 0;" width="100%" cellspacing="0" cellpadding="0" valign="top" border="0" | | |
| − | + | |style="font-size:100%; text-align:center; border-left:1px solid #ffffff; border-right:1px solid #ffffff;background-color:#203470; padding:12px;" width="20%" |[[ANLY482_AY2016-17_T2_Group11: Project Findings | <font color="#FFF"><b>Interim</b></font>]] | |
| − | + | |style="font-size:100%; text-align:center; border-left:1px solid #ffffff; border-right:1px solid #ffffff;background-color:#5478E4; " width="20%" |[[ANLY482_AY2016-17_T2_Group11: Project Findings Final |<font color="#FFFFFF"><b>Final</b></font>]] | |
| + | |} | ||
[[Media:Group11_Interim_Slides.pdf|Interim Slides]] | [[Media:Group11_Interim_Slides.pdf|Interim Slides]] | ||
<br> | <br> | ||
| − | Interim Report | + | [[Media:ANLY482_Team11_InterimReport.pdf|Interim Report]] |
= Data Source= | = Data Source= | ||
Latest revision as of 21:08, 23 April 2017
| Interim | Final |
Contents
Data Source
All the data was taken from the 2015 PISA Database which is available from the PISA website (http://www.oecd.org/pisa/data/2015database/). The 2015 dataset contains the full set of responses from individual students, school principals, teachers, and parents. For this project, the team will be using the questionnaire, codebook, and compendia data from the PISA website.
Proposed Phases
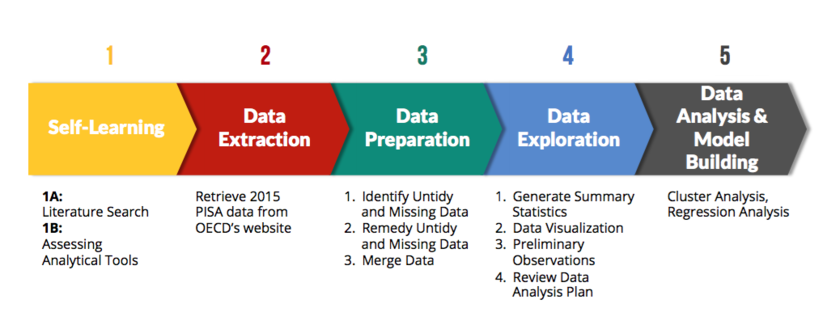
From the start of the project up to the interim presentation, phases 1 to 4 were done and the team's progress and findings are documented in the sections below.
Data Preparation
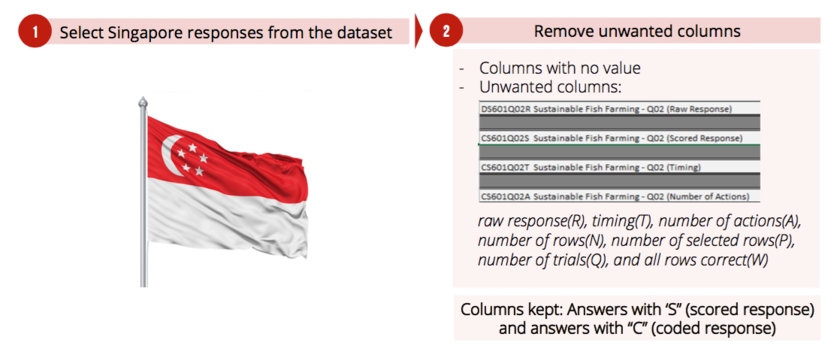
6 steps were done in preparing the data before the team could progress further in doing analysis of the data.
Preliminary Findings
Descriptive Analysis (Cognitive)
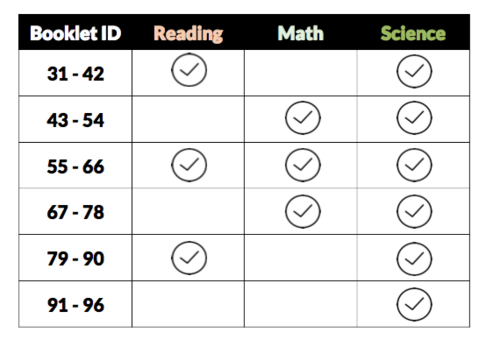
Booklet
From the booklets which the students answered, there were 3 subjects. These were: Reading, Math, and Science. The team discovered that different sets of booklets consist of different sets of questions from all or some of the 3 subjects and each booklet consists of different number of questions.
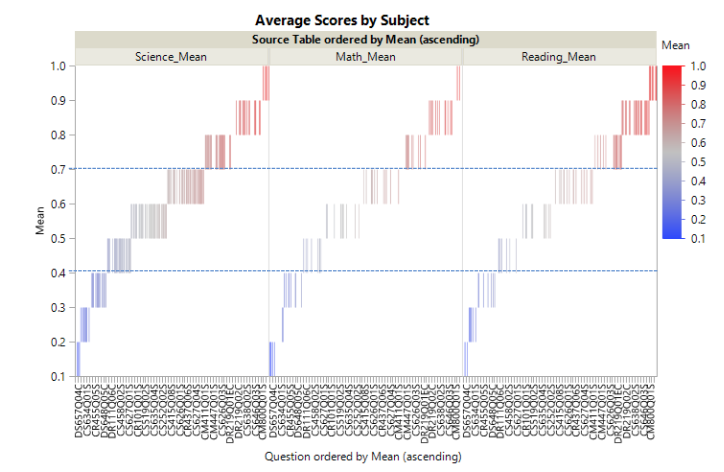
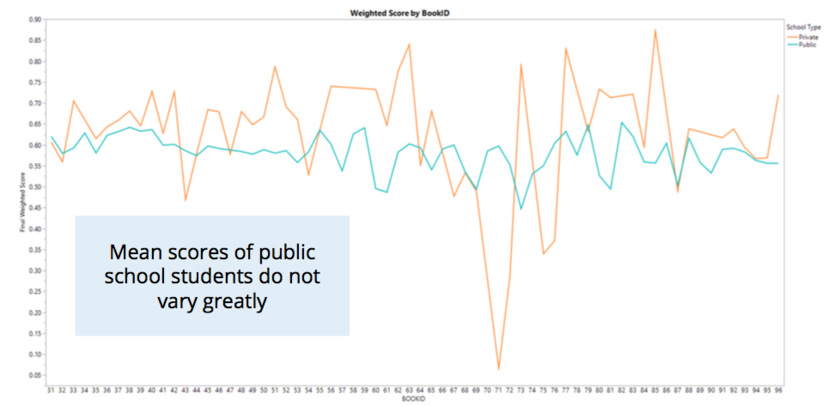
Mean Score
There was a wide range of mean scores across all questions and a similar pattern could be observed for all 3 subjects.
Segmentation
The questions were split into 3 segments based on difficulty. The bulk of the questions were placed in the middle segment which mean score falls in the range of 0.4 to 0.7.
Descriptive Analysis (School)
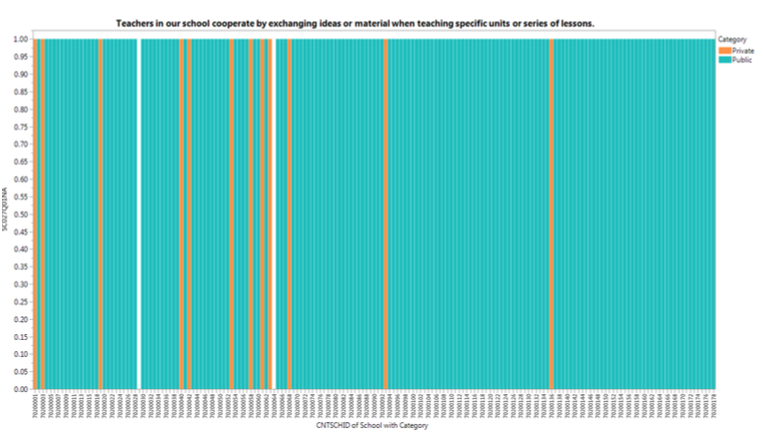
Uniform Response
The team observed that there were questions where all schools answered with the same answer. An insight for this is that there is a potential loophole that schools may be biased or afraid to answer truthfully.
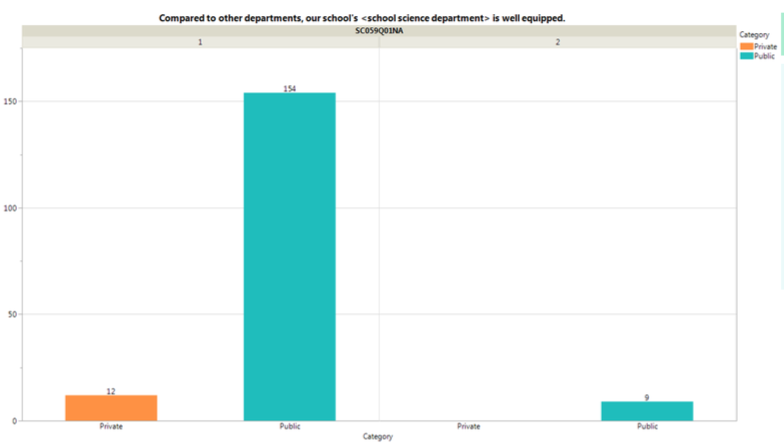
Science
The team observed that there were questions which were science specific which could be used together with the mean scores of the science questions. Science related questions asked to schools were related with how prepared and equipped the schools were to improve the learning of students.
Descriptive Analysis (Student)
Country of Birth
Most of the students who took the PISA test in Singapore were born in Singapore and both parents were also born in Singapore. There is a rather sizeable group of students who have parents born overseas.
Overall Challenge
Exploratory Analysis
Standardisation of Booklets
Challenge
- Different booklets were used for the test
- Each booklet consists of different sets of questions
Proposed Solution
- Find out the mean percentage of Easy, Medium, Hard questions for Reading, Mathematics and Science
- Use score percentage of students * mean percentage
Assumptions
- Mean scores are used as a proxy to determine level of difficulty
- Level of difficulty is perceived to be the same across all students
Overall Cognitive Analysis
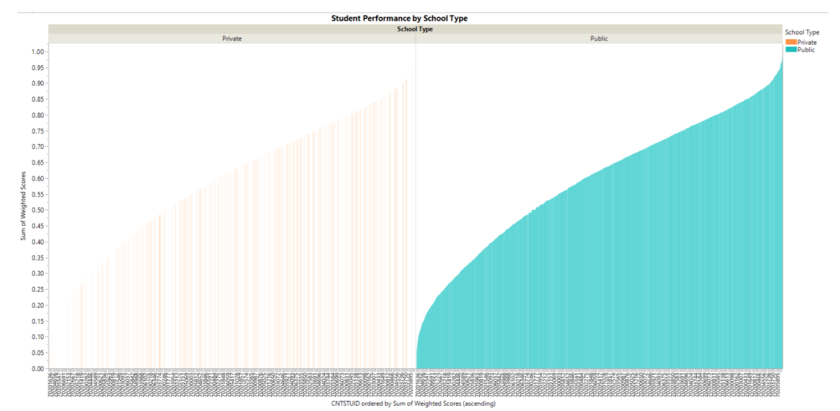
The team did an overview of the performance of all the students based on the booklets.
School Performance Analysis
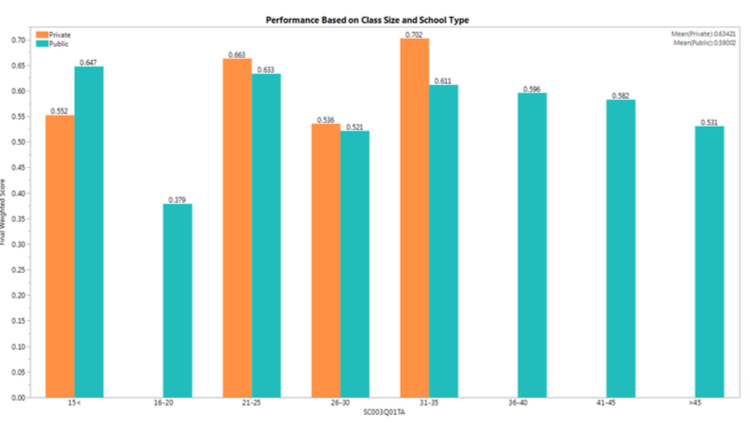
Class Size
- Private schools performed better than public schools in all class sizes except for classes with less than 15 students
Spending
- Schools which spent money on new equipment generally performed better than schools which did not.
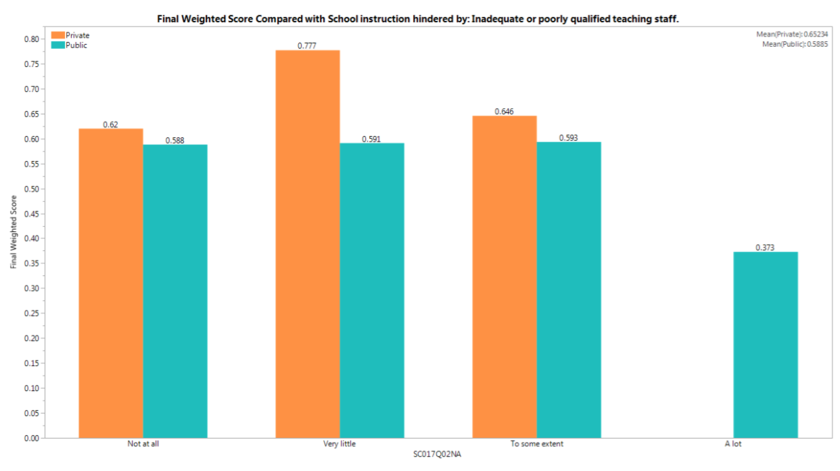
Quality of Teaching
- Schools which had inadequate or poorly qualified teaching staff performed poorer than the rest (34 public schools)
Autonomy
- Fully autonomous schools have the highest average scores compared to less autonomous schools
- The least autonomous schools have the lowest average score compared to the rest
Student Performance Analysis
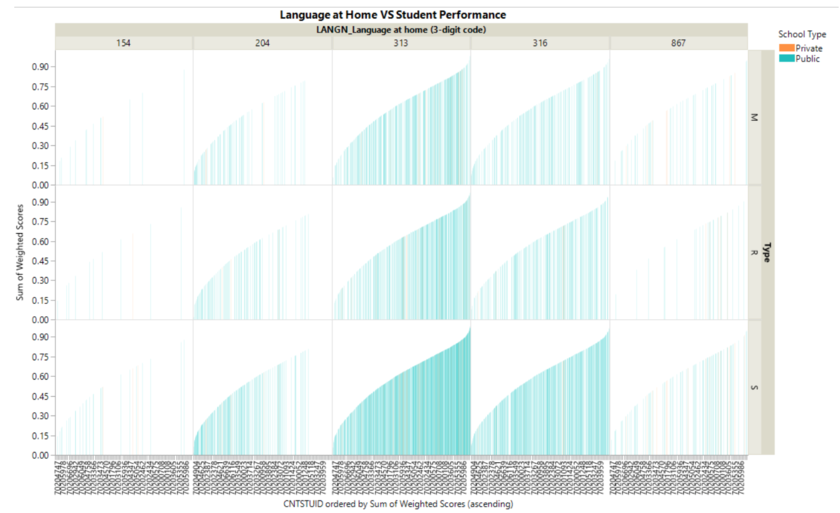
Language
- Similar trends observed for all languages
- To get more specific insights, further breakdown of students’ score required
Education of Parents
- GENERAL UPWARD TREND: Higher the parent’s education level, the higher the scores
- None of the students from private schools have parents with no education
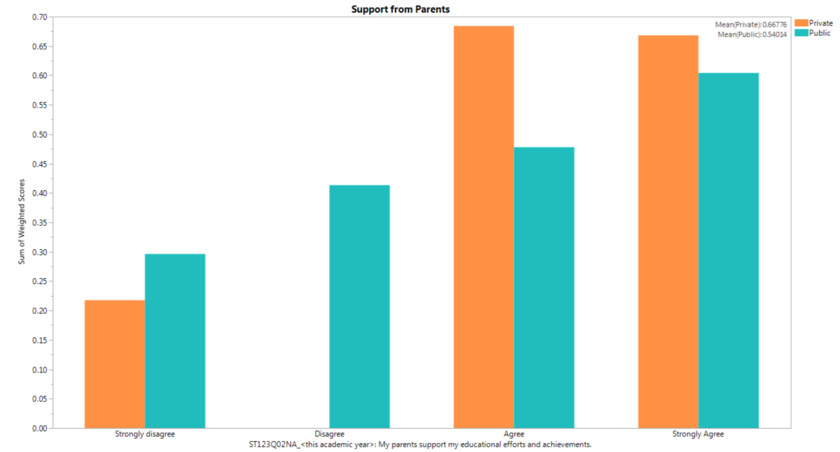
Support from Parents
- GENERAL UPWARD TREND: Higher the support from parents, higher the score
Overall Insight
Further Analyses
Regression Analysis
- Regression Analysis on factors affecting school’s performance
- Regression Analysis on factors affecting student’s performance in school
Cluster Analysis
- Cluster Analysis on schools based on their performance


