Red Dot Payment Data Source
| Background | Data Source | Methodology |
|---|
Sample Data
*Due to sensitivity of data, sample data will not be shown here. Please refer to the submitted reports for more details.
In our study, we incorporated 2 years of data, from 2016 to 2017. This data consists of the details of all online transactions processed by our sponsor from January 2016 to December 2017, such as:
• Date and time
• Monetary value
• Whether transaction is approved/rejected
• Reason for rejected transaction (i.e. reason code description)
• Currency type
Data Cleaning
For data cleaning, we carried out the following steps:
General Cleaning
1. Compiled 2016-2017 data
2. Standardised all merchants’ names and currency into uppercase: e.g. Realised that JMP Pro recognises characters with uppercase and lowercase separately
3. Standardised currency of all transaction values: Converted all non-SGD values into SGD values, based on average monthly historical exchange rates found on OANDA.com
4. Split ‘date_created’ column into ‘date’ and ‘time’ columns.
5. Created a new column ‘period’ to indicate the respective month of each date in the ‘date’ column (e.g. 01/01/16 → Period 1; 01/01/17 → Period 12)
6. Created a new column ‘hour’ to indicate respective hour of each time in the ‘time’ column (e.g. 1:00:00 AM → 1; 1:00:00 PM → 13)
7. Created a new column ‘day’ to indicate respective day in the week for each data in the ‘date’ column (e.g. Monday is assigned a value of 1, Sunday is assigned a value of 7)
8. Removed deactivated or terminated merchants
  - 2016: 41 transactions removed;
  - 2017: 841 transactions removed
9. Removed rows with ambiguous or illegible characters/ negative transaction value on JMP Pro:
  - Removal of 1563 rows with ambiguous or illegible characters;
  - Removal of 2 rows with negative transaction value
10. Merchant Categorisation Codes (MCC) was given at later stage to understand the industry sectors of the merchants
Removal of Outliers
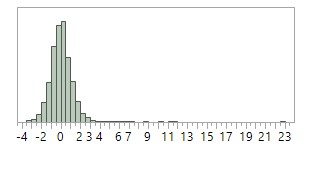
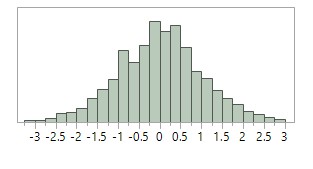
The raw data provided by our sponsor needed high levels of data cleansing. This includes standardizing all monetary value to Singapore currency, standardizing merchant names, and removing deactivated merchants. Furthermore, there were several confounding factors that could affect our analysis, such as test transactions carried out by merchants. To reduce the risk of inaccuracy, we excluded the outliers (i.e. monetary value belonging to top and bottom 0.5% and <$1) from our data. As seen in Figure 1 and 2, this resulted in a less skewed distribution.

Figure 1: Distribution graph of transaction monetary values (transformed using log10), before removing outliers

Figure 2: Distribution graph of transaction monetary values (transformed using log10), after removing outliers
Data Preparation
The cleaned data was loaded into JMP Pro to conduct data preparation and exploration. This analytical software can efficiently handle large volumes of data, which is essential given our sponsor's abundant data (approximately 2.2 million).
Data preparation was a time-consuming but necessary task in ensuring that our data is transformed into a suitable form for further analysis.
Using JMP, we have identified the top 3 types of rejected transactions: 1) Bank Rejected Transaction 2) Authentication Failed 3) Duplicate Merchant Tran_ID Detected
These values, termed as ‘reason code description’, are defined by our merchants’ registered bank. Moving forward, we will only be analysing these transactions and the approved transactions, to narrow down the scope of work.
Interactive Binning
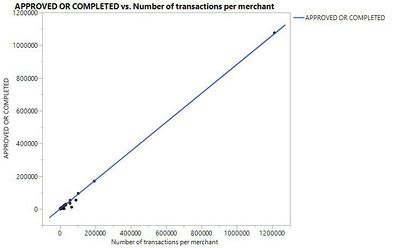
From our data, we realised that a huge discrepancy in the total number of transactions carried out by each merchant from 2016-2017; this range varies from 1 to 1212019. As shown in Figure 3, there is a high number of overlapping data in the scatter plot when plotting proportion of approved transactions for all 269 merchants using line of best fit graphs. This makes it less useful in assessing the performance of different merchants.

Figure 3: High number of overlapping data when plotting proportion of approve transactions for 269 merchants
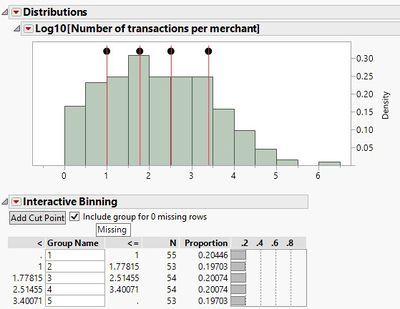
To compare the performance of merchants on a fairer ground, we have decided to group the merchants into 5 bins (i.e. cut-off points for binning at 20th percentile) based on the total number of transactions per merchant. To achieve this, we installed the Interactive Binning plugin by Jeff Perkinson.

Figure 4: Interactive binning results (I) (Cut-off point: 20th percentile)
We first used a log10 transformation on the variable ‘Number of transactions per merchant’. Seen in Figure 4, by setting the cut-off point at 20th percentile, we were able to obtain 5 different groups of merchants. Each group has a ‘Bin Number’, as seen in the table below. Each merchant thus has a respective bin number.
| Bin [Based on Log10] (Group) | Number of transactions per merchant (Range) | Number of merchants |
|---|---|---|
| 1 | 1 - 10 | 53 |
| 2 | 11 - 60 | 54 |
| 3 | 61 - 327 | 54 |
| 4 | 328 - 2516 | 53 |
| 5 | 2517 - 1,212,019 | 55 |