Arisaig Final Deliverable

From Analytics Practicum
Jump to navigation Jump to search
Appannalogo.png Home Project Proposal Project Management Project Progress Project Final Progress Final Deliverable


OUR STORYBOARD

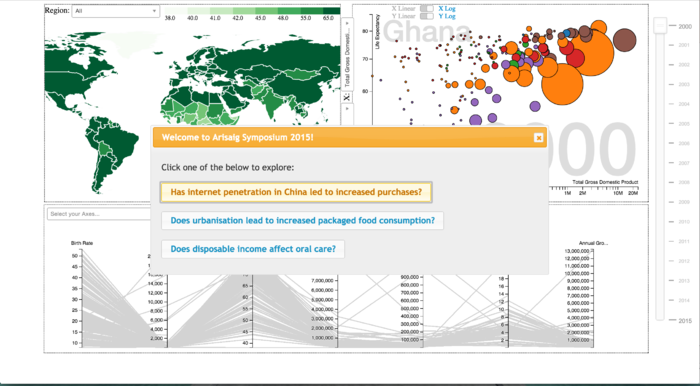
Arisaig App Context.png

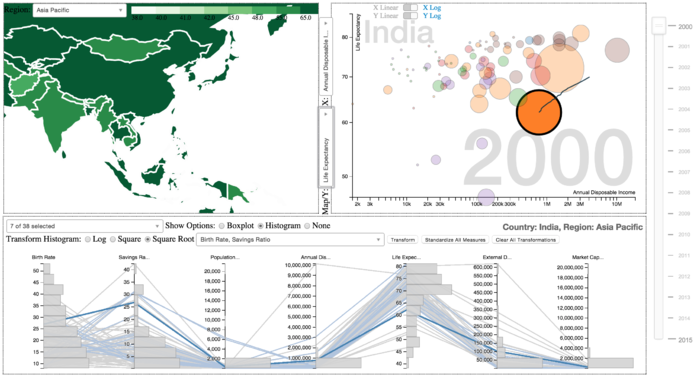
Arisaig Country Selected.png


SELECTED VISUALIZATIONS


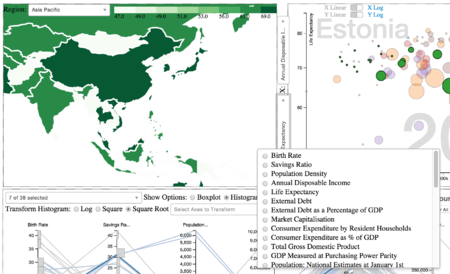
CHLOROPLETH


Chart Chosen Considerations
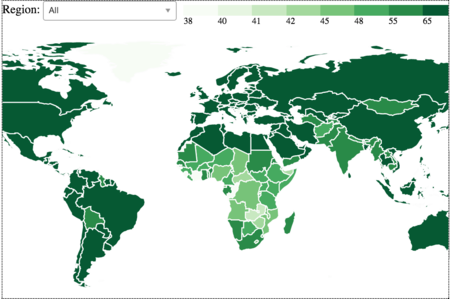
Arisaig Chloropleth1.png
  • Provide a map view to compare across the globe
  • Univariate representation of data
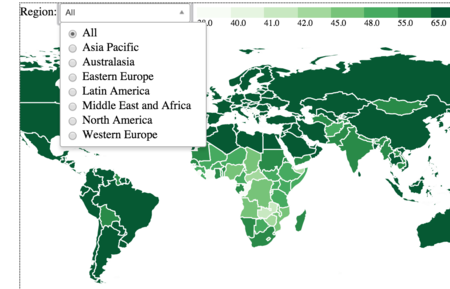
Arisaig Chloropleth2.png
  • The functionality of selecting region allows the user to focus only on selected region for comparison
Arisaig Map Select.png
  • Provide the flexibility for the user to see variable of interest
  • Provide the flexibility for Arisaig to update variables based on dataset


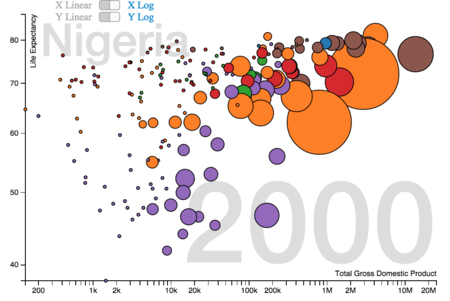
SCATTER PLOT


Chart Selected Considerations
Arisaig Scatterplot1.png
  • Provide a view of the distribution based on the bi-variante attributes
  • Provide flexibility for comparison through the use of dynamic variables load
  • Better data representation for logarithmic/linear scaling choice
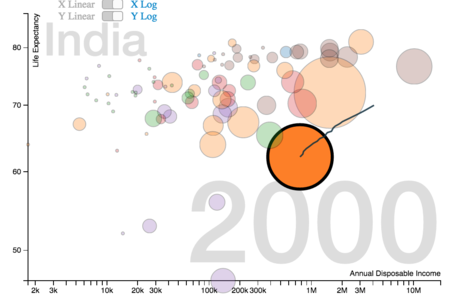
Arisaig Scatterplot2.png
  • Provide trend visualisation by introducing trajectory line of the temporal data


PARALLEL COORDINATES


Chart Selected Considerations
Arisaig Parallelcoords2.png
  • Provide a multi-variant view of the countries
  • Introduce dynamic feature by allowing free selection of axes that matter to the user
  • Introduce animation to cater to representation temporal data
Arisaig Parallelcoords3.png
  • Emphasis of the selected country as well as related countries (region)
  • Setting varying intensity to cater to user selection
Arisaig Parallelcoords4.png
  • Provide statistical insights like median, interquartile range & outliers
Arisaig Parallelcoords.png
  • Allow users to see the frequency distribution


FINAL REPORT

Here is the report