ANLY482 AY2017-18T2 Group03 Project Overview Old
| HOME | ABOUT US | PROJECT OVERVIEW | DATA ANALYSIS | PROJECT MANAGEMENT | DOCUMENTATION | MAIN PAGE |
| Previous | Current |
|---|
Contents
Motivation
The company has stayed ahead of their competition by embracing technology in the early days and now, they are starting to dabble into analytics in order to help make use of the large amount of data that they have generated throughout the course of their business. Currently, these information is being stored in their proprietary Warehouse Management System (WMS) which captures transaction information whenever goods are moving in, out or within the warehouse. The amount of information being managed by the system is massive and it is very complicated, thus managers have to spend time to use pivot tables in excel to better visualize the information being generated in order to get a better view of how the current operations is being run. This uses up valuable time which could have been used for other more important operational matters.
Also, manhour management is also very important as the amount of volume that the material handlers can handle is limited to 7 containers for inbound and 7 containers for outbound. Anymore than this and overtime will be required. Currently, material handlers are the ones that request for overtime hours whenever the volume of work exceeds the current baseline threshold. Thus, it is up to the judgement of the manager on the ground to make the final call on how long the material handlers need to overtime. As a result, there are cases of material handlers taking more overtime than necessary leading to increased cost which leads to the company having their margins beings reduced due to this inefficiency as the client would only pay for a certain number of overtime hours based on the agreed service level agreement.
Objective and Goals
The main objectives of the project would be to do the following:
1. Create a Operations Dashboard to visualize the following KPIs
- Operations Productivity Chart
- The purpose of this chart is to visualize the operations performance at each hour of the day and see if the drop in productivity is line with the break timings and if there are additional timings which are unproductive.
- X-axis: Hour of the day
- Y-axis: Number of pallets successfully serviced
- Product Ranking Chart
- The purpose of this chart is to find out which are the best-selling items and which are the least popular items.
- Treemap view of the products filtered by month / year
- Product Seasonality Chart
- The purpose of this chart is to see the seasonality factors of the different products.
- X-axis: Month of the year
- Y-axis: Number of pallets
- Actual Overtime Hours Chart (Dual-axis chart), these charts will be made up of 2 lines, one for the total number of overtime hours incurred and another being the total number of containers that were completed for the day. One chart will be used for the morning shift and another chart will be used for the night shift.
- The purpose of this chart is to visualize the number of overtime hours for the month in a timeline view so that managers can see the overtime performance of the operations in relation to the number of additional containers that need to be serviced for the day
- X-axis: Date of the month
- Y-axis: Number of overtime hours
- Y-axis: Number of containers
- Overtime Performance Analysis Chart
- The purpose of this chart is to use the historical timings to come-up with a baseline overtime hour required for varying number of additional containers.
- X-axis: Number of containers over the threshold limit
- Y-axis: Average time taken to complete the additional order
2. Validate if the current operation performance is in-line with the baseline performance of 7 containers of inbound and 7 containers of outbound per working shift.
Provided Data
The data provided by our sponsor are obtained from 3 of their in-house systems:
- Warehouse Management System (WMS) - The warehouse management system is used to keep track of the movement of the goods coming in, going out and within the warehouse itself. The WMS is a proprietary system developed in-house.
- Reporting System (RS) - This system provides the company with performance management systems which allow the company to manage their KPIs. Data from the WMS is being fed into the RS in order to generate summary reports.
- Human Resources System (HRS) - This system provides information on the permanent employees’ working hours and overtime hours.
For the purpose of this project, our sponsor has provided us with data for one of their client, which is a company selling powdered milk cans. This includes the inbound and outbound products for the year 2017. There are several excel workbooks provided which we will explain below.
From Warehouse Management System
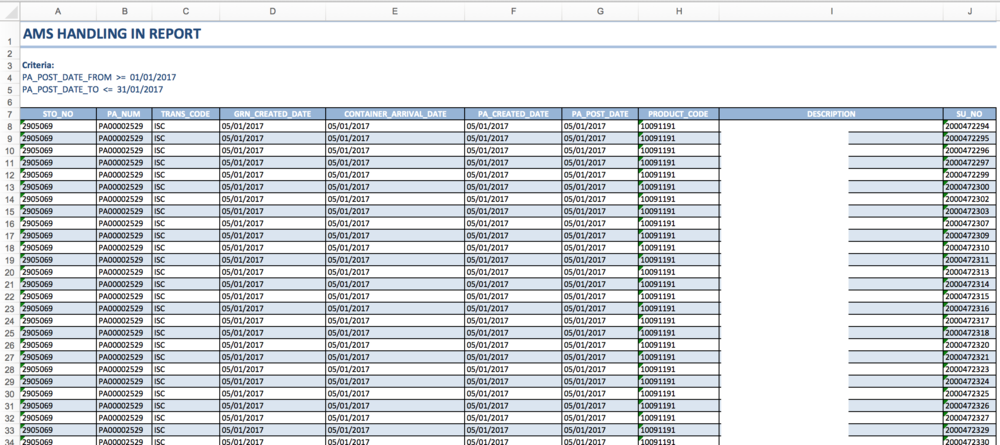
Handling In Report
There is a total of around 140,000 rows of data spanning across January to December 2017 for the Inbound orders for this client. Each row represents a pallet.

*The description is blanked out because it contains information about the client’s products
| Terminology | Description |
|---|---|
| STO No | Unique identifier for a particular inbound order. It is the same as the Customer Ref No in Inbound Order Status Summary Report from RS |
| Trans Code | There are several trans code, but we will only focus on:
|
| GRN Created Date | Goods Received Note. Once GRN is recorded, it means that inbound process is completed. |
| PA Created Date | The date when the putaway job is created. |
| PA Post Date | EThe date when the putaway job is completed. |
| Description | The product which will be stored in the warehouse e.g. Brand X 850g powdered milk cans or Brand X 400g powdered milk cans. |
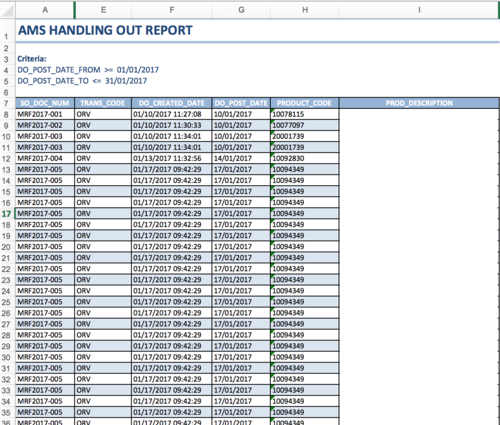
Handling Out Report
The number of Outbound orders for this client from January 2017 to December 2017 is approximately 81,000 rows of data. Each row represents a pallet.

*The description is blanked out because it contains information about the client’s products
| Terminology | Description |
|---|---|
| SO Doc Num | Unique identifier for a particular outbound order. It is the same as the Order Num in Outbound Order Status Summary Report from RS. |
| Trans Code | There are several trans code, but we will only focus on:
These 3 trans codes are to be taken into consideration because there is a physical movement of goods. |
| DO Created Date | The date which the delivery order is created. |
| DO Post Date | The date which the delivery order is completed. |
| Product Code | Unique identifier of a product. |
| Prod Description | The product which will be stored in the warehouse e.g. Brand X 850g powdered milk cans or Brand X 400g powdered milk cans. |
From Reporting System
Inbound Order Status Summary Report
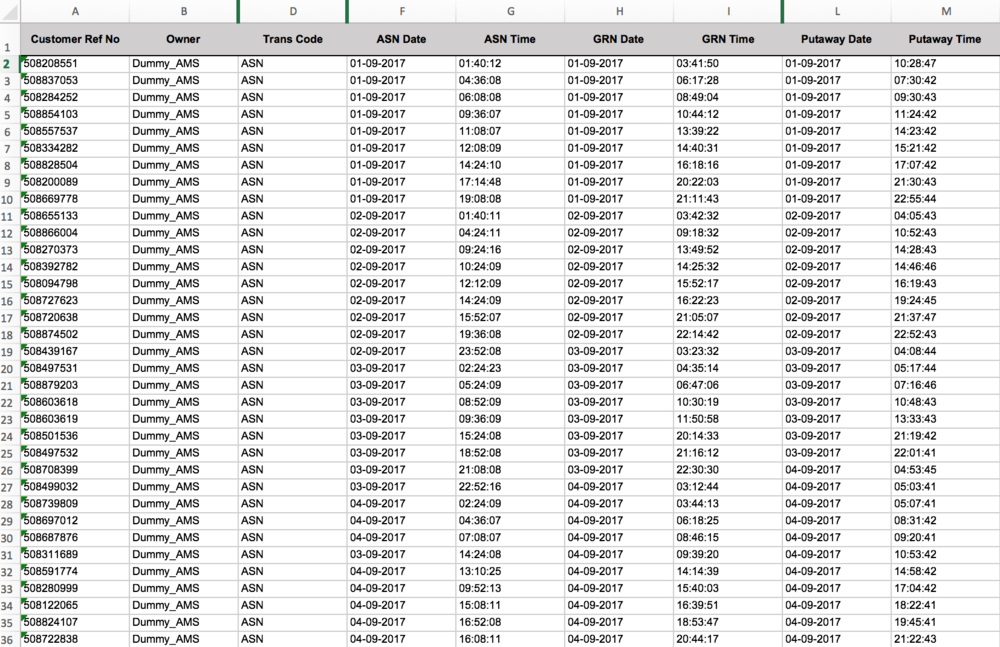
There is a total of around 3,000 rows of data spanning across January to December 2017 for the Inbound orders for this client from RS. This number is significant lesser than the Handling In Report as it is an aggregation of the data from WMS. Each row represents a container, which contains 22 pallets.
A snippet of the data for a Inbound Order Status Summary Report is shown below.

| Terminology | Description |
|---|---|
| Customer Ref No | Unique identifier for a particular inbound order. It is the same as the STO No in Handling In Report from WMS. |
| ASN Date/Time | Arrival Shipment Notice. It refers to the timing when the goods leave the production plant. |
| GRN Date/Time | Goods Received Note. Once GRN is recorded, it means that inbound process is completed. |
| Putaway Date/Time | The putaway timing refers to the time after which processing of a pallet is complete. It is usually 15 minutes after the reporting of GRN. |
The difference between ASN Date/Time and GRN Date/Time is the total time taken for goods to finish its inbound process after leaving the production plant. This includes the travelling time and the handling in time. However, we are only interested in the handling in time which is the time taken for the workers to complete the handling in. Yet, this timing is not available because the time which the truck arrives at the warehouse for handling in is not recorded. Therefore, we will have to make an assumption on the average time taken to travel from the production plant to the warehouse, which is from Tampines to Tuas. To ensure a more accurate timing of the actual handling in time, we will recommend our sponsor to start collecting this information as well.
Outbound Order Status Summary Report
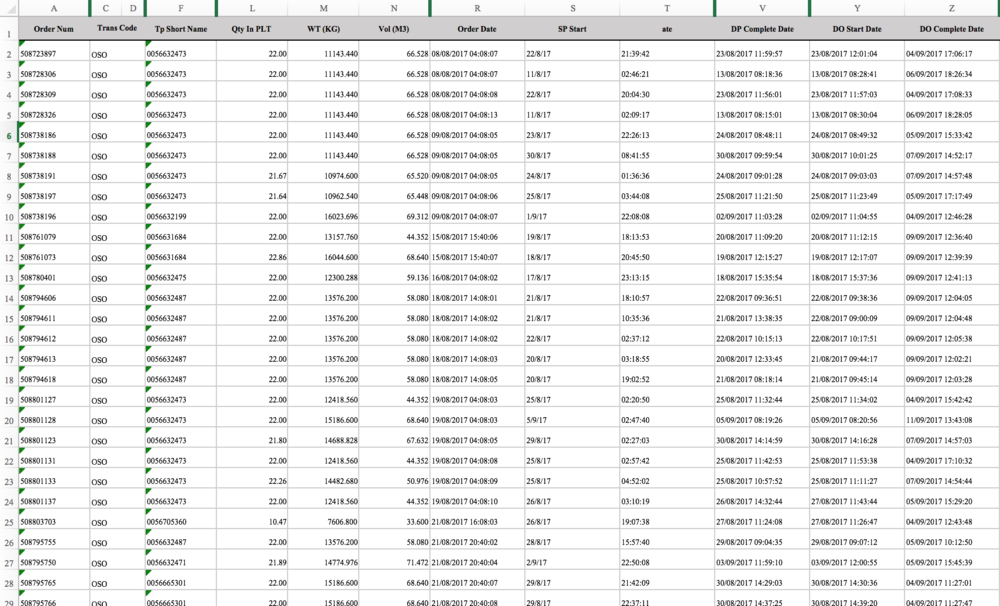
There is a total of around 4,000 rows of data spanning across January to December 2017 for the Outbound orders for this client from RS. This number is significant lesser than the Handling Out Report as it is an aggregation of the data from WMS. Each row represents a container, which contains 22 pallets.
A snippet of the data for a typical Outbound Order Status Summary Report is shown below.

| Terminology | Description |
|---|---|
| Order Num | Unique identifier for a particular outbound order. It is the same as the SO Doc Num in Handling Out Report from WMS. |
| Trans Code | There are several trans code, but we will only focus on:
These 3 trans codes are to be taken into consideration because there is a physical movement of goods. |
| Qty in PLT | Quantity in Pallet, which will be rounded up to whole number. |
| DP Start Date | DP (direct picking) start refers to the operational trigger time when operation starts. |
From Human Resources System
Overtime Hours Report
The report on the number of working hours and overtime hours for the permanent staff can be retrieved from the HRS. This information helps the Operations Manager to get a sense of the estimated number of overtime hours required for a client storing this type of products.
Given the nature of a warehousing business, a client typically releases a Request For Quotation (RFQ) and a logistics provider will bid for the project. The contract will consist of a service level agreement which determines the number of workers that can be used per shift, the total number of overtime hours that the client agrees to pay, the amount of transactions that the client must provide each month, and etc.
Thus, since the amount of overtime that the client is willing to pay is fixed, overtime must be properly planned so that the company will not exceed the agreed amount of overtime as this would lead to reduced margins from the client.
Limitations
As with any other real life projects, there are definitely limitations which we face especially with regards to the availability of data.
| S/N | Limitations | Conclusions |
|---|---|---|
| 1 | The current data provided only consists of information from 1 company, which sells powdered milk cans, that our sponsor company is handling. | We assume that the same analysis can be replicated for the logistic warehousing of other companies’ products which are similar in nature. |
| 2 | There is a lack of information on the exact time taken to complete the inbound storage as they do not record the timestamp when the truck arrives at the warehouse for handling in to take place. | With the lack of this information, we cannot analyse the time to complete a particular order and predict the time required to complete an inbound order. We will recommend our sponsor to record this information because we feel that it will be useful to analyse the operations productivity. For the purpose of our project, we will come up with an estimate for the travelling time from the production plant to the warehouse. |
| 3 | Out of the 12 workers involved in the logistics work for this company, there are 3 contract staff. However, there is also a lack of information on the overtime hours of these contract workers. | The lack of information on overtime hours for contract workers will affect the accuracy of our findings and analysis. However, we will assume that the average overtime hours of the contract staff is the same as the average overtime hours of the permanent staff. |
| 4 | The workers allocated to work for Inbound can also help the staff allocated to work for Outbound and vice versa. For overtime, staff working on Inbound can help to do overtime for Outbound processes. However, there is no record on which worker is allocated for Inbound and which worker is allocated for Outbound process. | We will assume that all overtime work will be split based on the excess demand, which is determined by more than 7 trucks, for Inbound and Outbound. For example, there are 10 Inbounds and 9 Outbounds for a shift and the overtime hours are 10 hours in total, the overtime used for Inbound = 10 / ((10-7) + (9-7)) * (10-7) = 6 hours. |
| 5 | The data provided from the WMS may not be totally representative of all the Inbound and Outbound transactions for this client as there may be human errors involved e.g. Worker did not scan the barcode | However, as the data size provided is sufficiently large (over 100k of data), the small percentage of potential human errors can be neglected. Therefore, the analysis conducted will still be considerably accurate. |
Important Information about the Business Process
- One container can hold up to 22 pallets.
- Morning shift is from 08:00 to 17:30. Night shift is from 18:00 to 07:30. Refer to the table below for an exact schedule for both shifts.
- Each shift is made up of 6 people, 4 for outbound, 2 for inbound but they can do the roles of the other function if they have nothing to do.
- The morning shift does more inbound activity while the night shift does more outbound activities due to the nature of the drivers. Drivers work normal office hours, so there is more inbound activity for the morning shift.
- There are 6 forklifts being used throughout the operations, there is a break to charge the forklifts from 00:00 - 01:00 everyday.
- The current baseline level of operations activity per day is 14 containers, 7 for inbound and 7 for outbound. Anything more than this and overtime will be required.
- For the data coming from the WMS, each row represents one pallet while for data coming from the RS, each row represents one container (22 pallets).
Daily Schedule
| 08:00 to 17:30 | Morning Shift |
| 10:00 to 10:15 | Break |
| 12:00 to 13:00 | Lunch Break |
| 15:00 to 15:15 | Tea Break |
| 17:30 to 18:00 | Dinner Break |
| 18:00 to 07:30 | Night Shift |
| 22:00 to 22:15 | Break |
| 00:00 to 01:00 | Supper Break |
| 03:00 to 03:15 | Tea Break |
Project Scope
1. Data Gathering and Scoping
Our sponsor has given us various excel spreadsheets with data for 2017, as mentioned above, for a client selling powdered milk cans. Our project scope includes analysing the products ranking, products seasonality, operations productivity and overtime hours used to meet the demand. With the data, we will perform Exploratory Data Analysis using JMP Software.
2. Tools to be Used
We will be using several tools to aid us int he development of our dashboard and to carry out our analysis.
| JMP Software | JMP Software is developed by the JMP business unit of SAS institute and it is a powerful tool for analytics. Our team plans to use JMP Software for Exploratory Data Analysis. |
| Highcharts and JavaScript | Highcharts is a simple-to-use charting library written in JavaScript which allows us to add interactive charts to our web application for the dashboard. It will be used to develop our dashboard for the various visualisations mentioned above. |
| Python | Python is a programming language which we will use to create a script meant for cleaning the dataset when it is uploaded. |
| PostgreSQL | PostgreSQL is an object-relational database management system which will be used to store the data from the CSV files. |
3. Data Cleaning, Wrangling and Restructuring
Our team aims to combine the information from various excel spreadsheets into one central pool for Inbound and one for Outbound by using their unique identifier to link the data together. Data cleaning will be done using Python to handling missing values and duplicate data, after integrating the data.
The team will also use Python to write a script which will combine the various excel spreadsheets and extract the relevant fields before consolidating them into a single spreadsheet that will be used as an input for the analysis and the Operations Dashboard. All the data that is uploaded will be stored into a PostgreSQL database, which serves as the database of information for the dashboard.
4. Data Visualization and Reporting
Once the data is cleaned and combined, we will extract the data and create a dashboard with various visualisations as mentioned earlier. This will be done using Highcharts and JavaScript. The interactive dashboard will allow managers to have easy access to visualisations showing the performance of the current operations as compared to past operations.
We will also analyse the data provided so that we can evaluate if their current operations are operating within their current baseline threshold and is the current operations sustainable. Lastly, we will also research on the feasibility of doing a model to help the Operations Managers find out how much overtime hours are required based on the amount of outstanding work and workers on hand.
