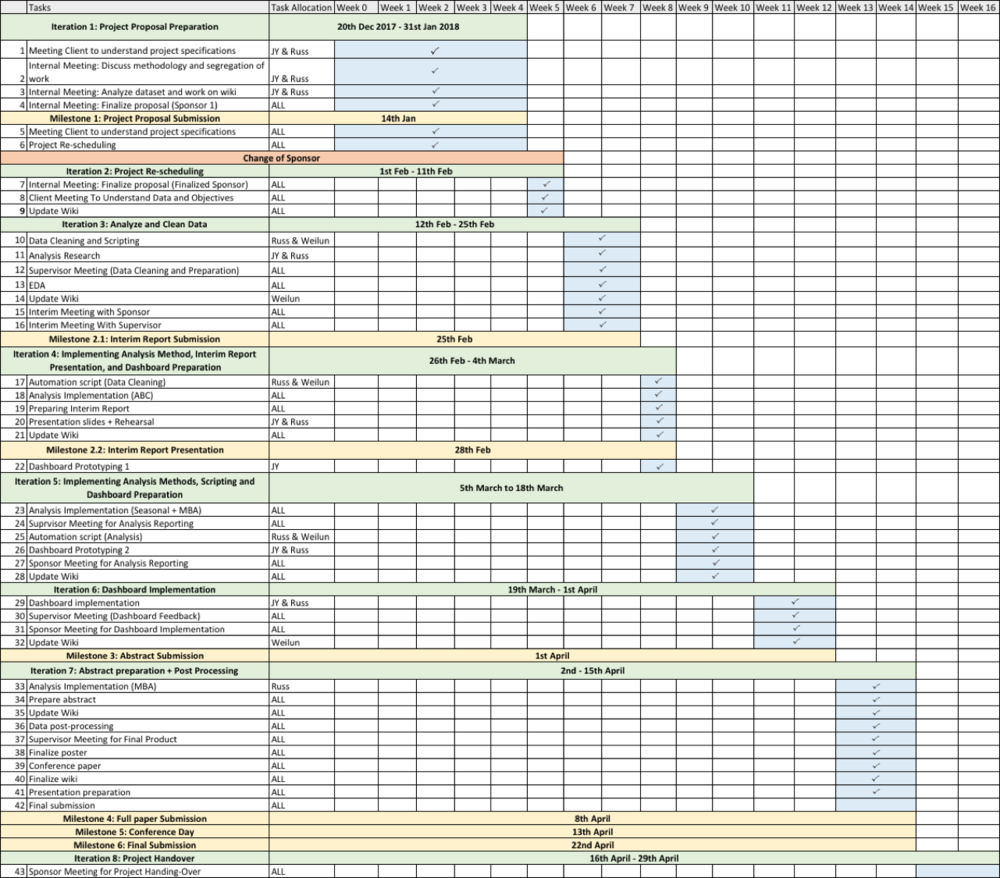
| Sponsor Requirement Change Log |
|---|
| Date | Milestone | Dataset | Feature Requirement (Before) | Feature Requirement (After) | Status | Status Description |
|---|
| 20th Jan |
Post Project Proposal |
All data were given in excel format
- AMS Handling In Report
- AMS Handling Out Report
- Headcount Report
- orderStatusSummaryReport
- stdInboundOrderReport
|
• Find a way to calculate the amount of workers and total overtime hours needed in order to satisfy the order requirement for any day.
|
As there was no way for them to provide us with information on the time taken taken to complete each task, we would have no way to come up with the model to derive the number of workers required for the amount of workload provided. On top of that, they were unable to provide us with the number of hours worked for each worker and which day the worker actually worked, making it almost impossible to link their individual performance to actual work completed.
|
- Discuss with sponsor immediately to see if they can provide us with a new data set in order to carry on with the project.
- Russell to follow up.
|
Complete as of 26th January |
| 31st Jan |
Post Project Proposal |
All data were given in excel format
- Molex Outbound Report 2015, 2016 and 2017 (3 files)
- Molex Inbound Report 2015, 2016 and 2017 (3 files)
|
• Find a way to calculate the amount of workers and total overtime hours needed in order to satisfy the order requirement for any day.
|
- ABC Analysis
- Seasonality Analysis
- Inventory Performance analysis
- Popular Product Analysis
|
- Feature has been confirmed after meeting with professor on 31st January 2017.
- We were advised to explore the data further and to ask for more information so that we can find a way to tie the inbound movements to the outbound movements
|
NIL |
| 14th Feb |
Post Project Proposal |
All data were given in excel format
- Inbound Report from October 2016 to December 2017
- Outbound Report from October 2016 to December 2017
|
- ABC Analysis
- Seasonality Analysis
- Inventory Performance Analysis
- Market Basket Analysis
|
- Same types of analysis
- Instead of 2015 to 2017, rescope to October 2016 to December 2017 because the company shifted warehouse in September 2016
|
- Feature has been confirmed after meeting with professor on 14th February 2017.
- Advised to look at data from October 2016 only because of the shifting of warehouse and changes in internal systems which resulted in the dataset to be different before and after October 2016.
|
NIL |

